
Key Takeaways
- CloudWatch Omni unifies agent traces, 17 built-in evaluators, and side-by-side experiments across VS Code, Kiro, and a standalone web experience outside the AWS Console.
- Trace Explorer, Compare mode, Agent Topology, and golden-dataset experiments expose every LLM call, tool invocation, and reasoning step — surfacing semantic failures that latency and error monitors never see.
- An observability market projected to reach USD 6.93 billion by 2031, with AI-native instrumentation adding 3.2 points to CAGR, makes eval-driven telemetry the new growth engine.
Table of Contents
AWS Retools Observability for Agents That Refuse to Be Deterministic
AWS News Blog broke the story that Amazon CloudWatch Omni is now generally available, targeting a blind spot that legacy monitoring was never designed to see. The new platform unifies traces, built-in evaluators, and experiment tooling across VS Code, Kiro, and a standalone web experience outside the AWS Management Console.
The core problem is structural: agents make multiple decisions per invocation, choosing tools and chaining LLM calls, so traditional latency and error rates miss semantic failures. CloudWatch Omni records every step and scores outputs against quality dimensions such as coherence, correctness, and retrieval quality.
Inside Omni: Traces, Evaluators, and Experimentation Without the Console
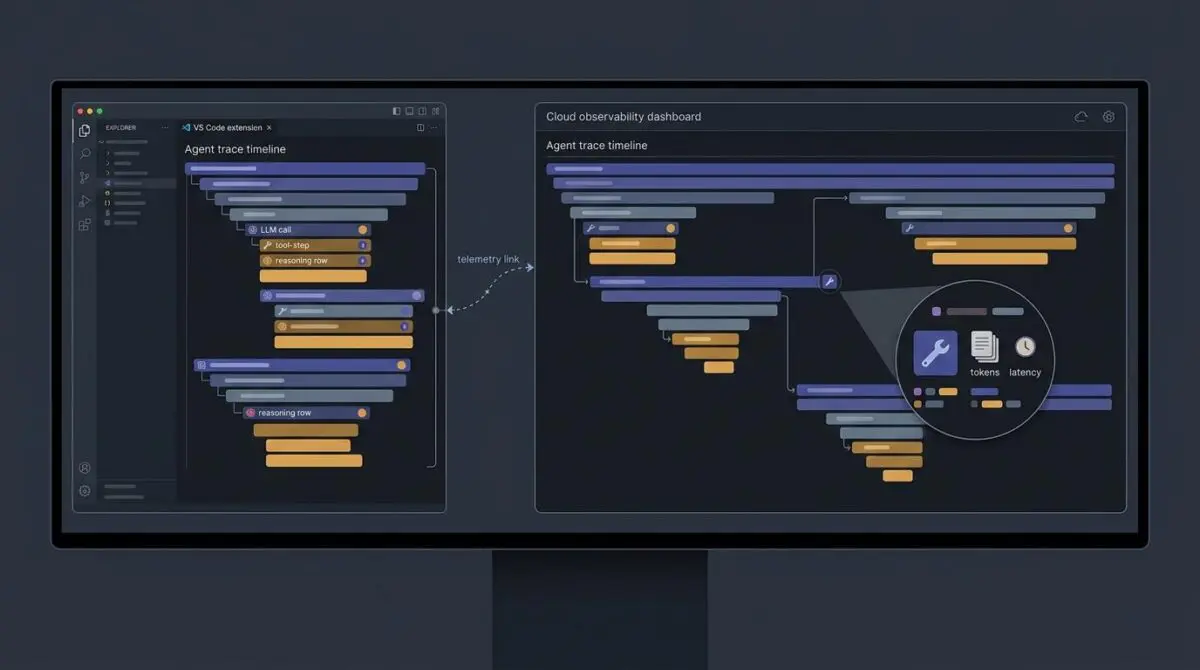
CloudWatch Omni delivers observability through two surfaces that share the same trace data. Developers get a native extension in VS Code and Kiro, while operators get a standalone web experience separate from the AWS Management Console.
The AWS News Blog reports that the extension shows traces as an agent runs, with a playground and evaluators one click away. The web view covers the same telemetry through SSO, so a trace a developer debugs locally is the same artifact an operator investigates in production.
Cloud Login makes the local-to-cloud handoff optional. An engineer can keep all data on the local machine during development, then connect to AWS when persistent storage, team sharing, and production dashboards are needed.
CloudWatch Omni also integrates with AI code assistants such as Kiro, Claude Code, and Codex to configure the Dev Server and install dependencies. That reduces the path from installation to a first traced agent session to minutes rather than a manual configuration exercise.
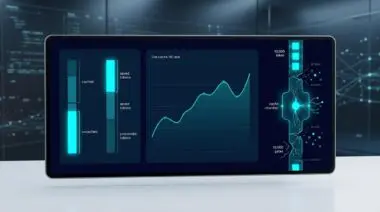
At the center of the workflow is the Trace Explorer. It renders every LLM call, tool invocation, and reasoning step as a structured hierarchical timeline, with drill-down access to inputs, outputs, token usage, and latency.
Compare mode places two traces side by side to expose how prompt or configuration changes alter behavior. The ‘Ask Assistant’ feature lets an AI agent analyze traces and answer questions such as why a tool was called twice.
Evaluation is the layer that turns raw observability into quality engineering. CloudWatch Omni ships 17 built-in evaluators covering dimensions like coherence, helpfulness, faithfulness, and routing correctness.
An engineer can select traces, choose evaluators, and run an evaluation without building a custom framework. Results arrive as per-example scores and aggregate metrics, which standard latency and error monitors would never surface.
The Playground compares system prompts and model configurations side by side. Experiments then run the same dataset against two agent variants to compare evaluation scores, latency, and token usage before a change is committed.
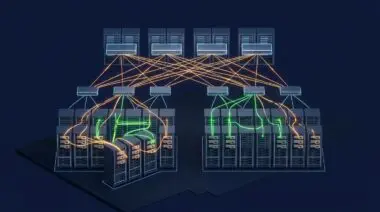
Prompt Management versions and tracks prompt configurations over time. Session Explorer reconstructs full conversation histories for multi-turn interactions, while Agent Topology visualizes sub-agents, tools, and interconnections for bottleneck analysis.
Production traces can be curated into golden datasets for structured regression testing. The Experiment function runs an agent against that dataset and scores results automatically, creating benchmarks whenever prompts or agent logic change.
- Frameworks — LangChain, LangGraph, CrewAI, OpenAI SDK, Strands, Vercel AI SDK, and others in Python and TypeScript.
- Instrumentation — auto-instrumentation via Kiro detects the framework and configures tracing; manual snippets are available for Python and TypeScript.
- Open standards — OpenInference and ADOT keep telemetry portable across Lambda, ECS, EKS, and other clouds.
- Third-party evaluators — Braintrust, DeepEval, and Ragas integrate alongside built-in datasets, the playground, and batch experiments.
- Bedrock AgentCore — native observability and evaluation flow directly in the Omni workflow.
The IDE extension is free to start. Users need AWS credentials for Amazon Bedrock models or API keys from providers such as OpenAI or Anthropic.
The $6.93 Billion Signal: AI-Native Instrumentation Is Becoming the Growth Engine
As of late September 2026, CloudWatch Omni is landing in a market expansion that is being pulled specifically by AI workloads. Mordor Intelligence estimates the global observability market reached USD 2.9 billion in 2025 and projects it will hit USD 6.93 billion by 2031, a 15.62% compound annual growth rate.
That growth is not evenly distributed. Cloud and SaaS deployments account for 68.40% of 2025 spending, while hybrid deployment is forecast to grow at 20.12% CAGR. North America still leads with 36.65% of revenue, but Asia-Pacific is projected to be the fastest region at 19.62%.
The demand drivers are revealing. AI-native instrumentation adds an estimated 3.2 percentage points to the CAGR forecast, while generative AI demand for model visibility adds 2.9 percentage points. OpenTelemetry standardization follows with a 2.1 percentage-point contribution. In other words, the same open, AI-aware telemetry pattern that CloudWatch Omni uses is now a measurable market force.
Competitive pressure is intensifying. Datadog posted USD 3.3 billion in 2025 revenue, and New Relic unveiled its Intelligent Observability Platform in February 2025. AWS is not entering an empty category; it is pushing an IDE-first, eval-driven workflow into a space where incumbent players dominate enterprise dashboards.
A separate AWS technical post on the AWS Machine Learning Blog shows the broader integration play. It details how Deepgram self-hosted speech AI metrics flow into CloudWatch through the embedded metric format, with no sidecar, no agent, and no added IAM permissions.
That matters for Omni’s positioning. The same CloudWatch pipeline that ingests infrastructure and application telemetry can now absorb agent traces, evaluations, and experiments without forcing re-platforming.
Another recent AWS technical post, focused on migrating multi-model healthcare agents to Bedrock AgentCore runtime, reinforces the direction. It shows the migration required no changes to core agent logic beyond adding the AgentCore decorator pattern, a sign that managed agent observability is becoming an operational default rather than a bolt-on.
Industry verticals reinforce the urgency. IT and telecom generated 29.55% of 2025 revenue, but healthcare and life sciences are projected to grow fastest at 21.86% CAGR, partly because agentic systems in regulated environments need audit-grade traceability.
What Omni Changes for AI Teams Right Now
CloudWatch Omni collapses the distance between local agent debugging and production monitoring, making semantic regressions visible before they reach users. For teams building observability-driven AI delivery pipelines, programmatic SEO and AI automation is how Andres SEO Expert approaches scalable technical execution — contact Andres SEO Expert.
Frequently Asked Questions
What is Amazon CloudWatch Omni?
Amazon CloudWatch Omni is a generally available AWS observability platform for generative AI and agentic workloads. It unifies traces, built-in evaluators, and experiment tooling across VS Code, Kiro, and a standalone web experience outside the AWS Management Console.
Why do AI agents need observability beyond latency and error monitoring?
AI agents are non-deterministic and make multiple decisions per invocation, including tool choices and chained LLM calls. Traditional latency and error rates can miss semantic failures, so CloudWatch Omni records every step and scores outputs for coherence, correctness, retrieval quality, and other quality dimensions.
What built-in evaluators does CloudWatch Omni include?
CloudWatch Omni ships 17 built-in evaluators covering dimensions such as coherence, helpfulness, faithfulness, and routing correctness. Engineers can select traces, choose evaluators, and run an evaluation without building a custom framework, receiving per-example scores and aggregate metrics.
How does CloudWatch Omni connect local development with production monitoring?
The VS Code and Kiro extension shows traces as an agent runs, with a playground and evaluators one click away. A standalone web experience uses SSO for operators. Cloud Login makes the local-to-cloud handoff optional, so a trace debugged locally can be the same artifact investigated in production.
Which frameworks and open standards does CloudWatch Omni support?
It supports frameworks such as LangChain, LangGraph, CrewAI, OpenAI SDK, Strands, and Vercel AI SDK in Python and TypeScript. It also uses OpenInference and ADOT for portable telemetry across Lambda, ECS, EKS, and other clouds, plus third-party evaluators like Braintrust, DeepEval, and Ragas.
How does CloudWatch Omni support experimentation and regression testing?
The Playground compares system prompts and model configurations side by side. Experiments run the same dataset against two agent variants to compare evaluation scores, latency, and token usage. Production traces can be curated into golden datasets for structured regression testing, and Experiment scores results automatically when prompts or agent logic change.
Is CloudWatch Omni free to start?
The IDE extension is free to start. Users need AWS credentials for Amazon Bedrock models or API keys from providers such as OpenAI or Anthropic. Cloud Login is optional, so teams can keep data local during development and connect to AWS for persistent storage, team sharing, and production dashboards.