

Executive Summary
- LogRocket is a frontend monitoring solution that captures DOM mutations, network requests, and JavaScript state to reconstruct user sessions with high fidelity.
- It enables performance engineers to diagnose Interaction to Next Paint (INP) and Cumulative Layout Shift (CLS) issues by visualizing the exact client-side execution environment.
- Strategic implementation involves managing the telemetry payload and sampling rates to ensure the monitoring script does not negatively impact the main thread or LCP.
What is LogRocket?
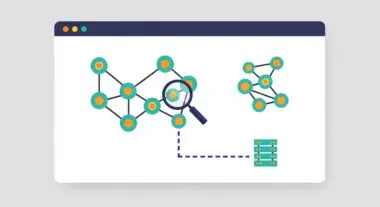
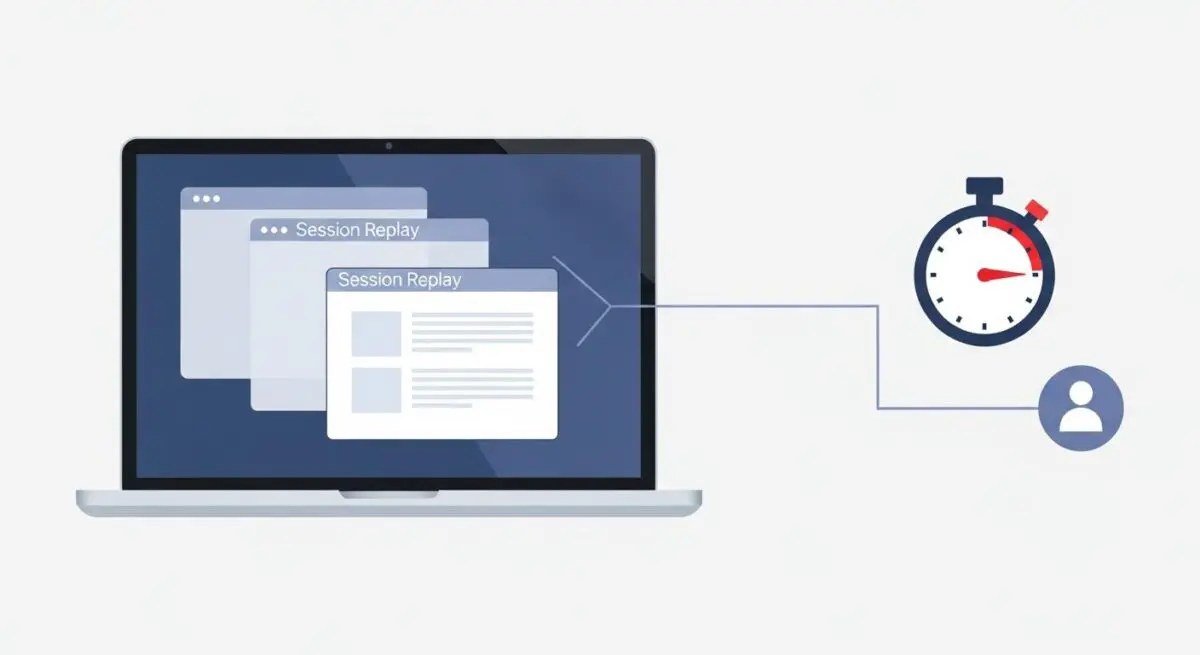
LogRocket is an advanced frontend monitoring and session replay platform designed to provide deep visibility into the client-side execution environment. Unlike traditional analytics tools that track page views or discrete events, LogRocket records every DOM mutation, network request, console log, and state change (such as Redux or Vuex actions). This allows developers to replay user sessions with pixel-perfect accuracy, effectively seeing exactly what the user saw and how the browser responded to their inputs in real-time.
From a technical perspective, LogRocket functions by intercepting browser APIs and observing changes to the Document Object Model (DOM) using a mutation observer pattern. It serializes these changes and transmits them as a stream of telemetry data to its backend servers. This data is then reconstructed in a sandboxed environment for analysis, providing a comprehensive audit trail of the frontend application’s state at any given millisecond. This level of granularity is essential for debugging complex, asynchronous interactions in modern Single Page Applications (SPAs) and Progressive Web Apps (PWAs).
The Real-World Analogy
Imagine a high-performance race car equipped with a sophisticated flight data recorder, often called a black box. While a standard speedometer tells you how fast the car is going, the black box records every steering input, brake pressure, engine temperature fluctuation, and gear shift. If the car suddenly loses speed on a specific corner, engineers do not have to guess what happened; they can replay the telemetry to see if the driver braked too late or if the engine misfired. LogRocket is that black box for your website, recording every technical nuance so you can diagnose why a performance regression or UI failure occurred.
Why is LogRocket Critical for Website Performance and Speed Engineering?
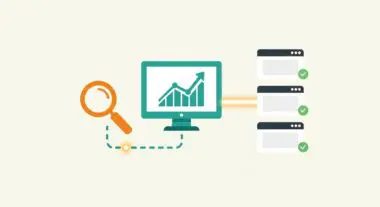
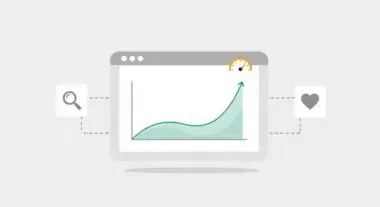
LogRocket is a vital component of the modern performance engineering stack because it bridges the gap between synthetic testing and Real User Monitoring (RUM). While tools like Lighthouse provide a snapshot of performance in a controlled environment, LogRocket reveals how real-world variables—such as varying CPU speeds, latent network connections, and third-party scripts—impact Core Web Vitals. It is particularly effective for identifying the root causes of Interaction to Next Paint (INP) issues, as it can highlight long-running JavaScript tasks that block the main thread during user interactions.
Furthermore, LogRocket’s performance monitoring suite allows engineers to correlate technical errors (like 404s or 500-series server responses) with specific performance regressions. By analyzing the network waterfall charts within a session replay, developers can pinpoint slow-loading assets or inefficient API calls that are inflating the Largest Contentful Paint (LCP). This data-driven approach ensures that optimization efforts are focused on the bottlenecks that have the highest impact on actual user experience and conversion rates.
Best Practices & Implementation
- Optimize Script Loading: Always load the LogRocket recording script asynchronously or via a tag manager with low priority to prevent it from becoming a render-blocking resource that delays the initial page load.
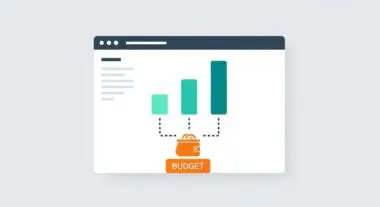
- Implement Intelligent Sampling: For high-traffic enterprise sites, use sampling rates to record a representative percentage of sessions rather than 100%, reducing the total data overhead and infrastructure costs while maintaining statistical significance.
- Sanitize Sensitive Data: Utilize LogRocket’s data masking features to ensure that Personally Identifiable Information (PII) is redacted on the client side before data is transmitted, maintaining compliance with GDPR and CCPA.
- Leverage Performance Alerts: Configure automated alerts for specific performance thresholds, such as a sudden spike in JS heap size or a drop in average First Input Delay (FID) scores across specific browser versions.
Common Mistakes to Avoid
One frequent error is failing to filter out internal traffic or automated bots, which can skew performance data and consume unnecessary recording quotas. Another common mistake is neglecting the performance impact of the recording script itself; if not configured correctly, the overhead of DOM observation can contribute to main-thread contention. Finally, many teams fail to integrate LogRocket with their existing error-tracking or project management workflows, leading to siloed data that is difficult for engineering teams to act upon quickly.
Conclusion
LogRocket provides the granular telemetry required to diagnose and resolve complex frontend performance issues in real-time. When implemented with a focus on script efficiency and data privacy, it becomes an indispensable tool for maintaining superior Core Web Vitals and user experience.