




Executive Summary
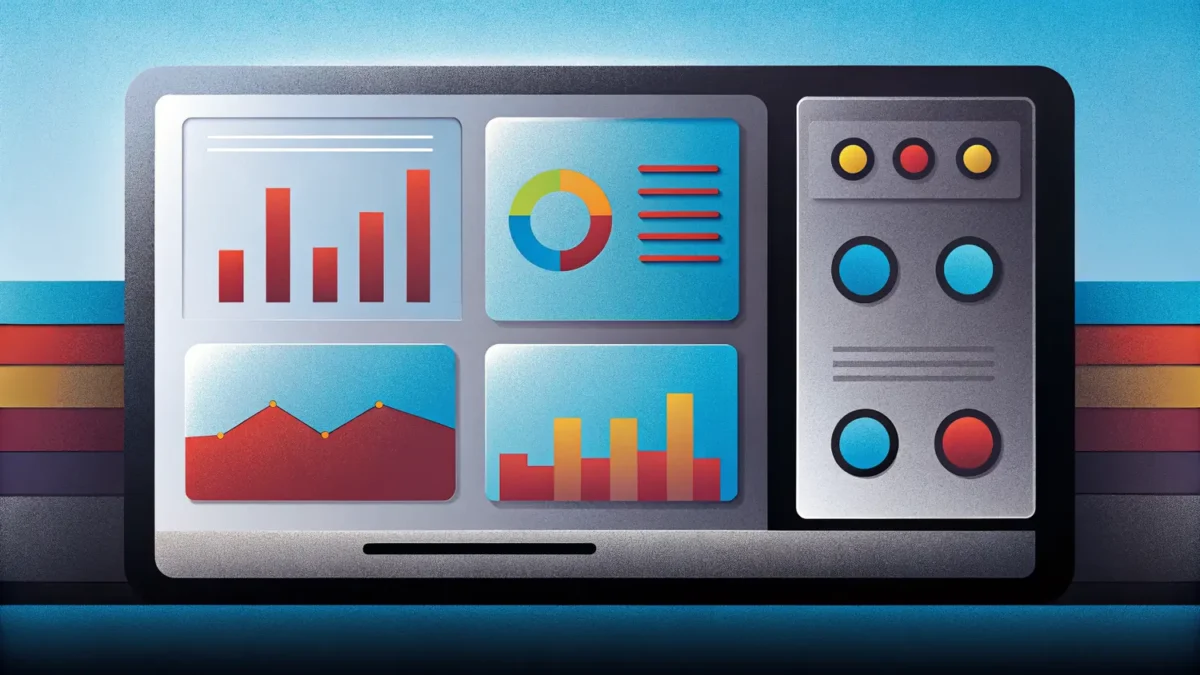
- Product Analytics is the systematic analysis of user interaction data within digital products to understand behavior, optimize features, and drive retention.
- It enables data-driven decisions on product roadmaps, reducing churn by identifying friction points and high-value user actions.
- Modern product analytics integrates with event tracking, cohort analysis, and funnel visualization to provide real-time insights for growth teams.
What is Product Analytics?
Product Analytics refers to the collection, measurement, and interpretation of user behavior data within a digital product—such as a mobile app, SaaS platform, or website. It focuses on how users interact with features, navigate flows, and progress through key actions like sign-ups, purchases, or engagement milestones.
Unlike web analytics (which tracks page views and sessions), product analytics is event-based and user-centric. It captures granular data points like button clicks, time spent on tasks, and feature adoption rates. This data is then aggregated into metrics such as retention rate, daily active users (DAU), and conversion funnels.
Modern product analytics platforms (e.g., Amplitude, Mixpanel, Heap) leverage behavioral cohorts, A/B testing integration, and predictive models to surface actionable insights. They enable product managers and engineers to validate hypotheses, prioritize features, and measure the impact of changes on user outcomes.
The Real-World Analogy
Think of Product Analytics as a fitness tracker for your digital product. Just as a fitness tracker monitors steps, heart rate, and sleep patterns to help you improve health, product analytics monitors user actions, drop-offs, and engagement to help you improve product health.
Without it, you’re guessing which features matter—like exercising without knowing your heart rate. With it, you can pinpoint exactly where users struggle (e.g., a confusing checkout flow) and optimize for better “fitness” (retention and conversion).
How Product Analytics Drives Strategic Growth & Market Competitiveness?
Product Analytics directly impacts growth by revealing the levers that drive user retention and monetization. By analyzing cohort retention curves, teams can identify which onboarding experiences lead to long-term engagement. For example, a SaaS company might discover that users who complete a specific setup wizard within the first 3 days have a 60% higher 90-day retention rate.
It also optimizes customer acquisition costs (CAC) by tying marketing channels to product behavior. Instead of relying on last-click attribution, product analytics shows which acquired users actually activate and retain. This allows reallocation of ad spend toward channels delivering high-quality users.
Furthermore, product analytics enables competitive differentiation through rapid experimentation. Teams can run A/B tests on feature variations, measure impact on key metrics like Net Promoter Score (NPS) or time-to-value, and iterate faster than competitors. This data-driven culture reduces guesswork and aligns engineering resources with revenue-generating initiatives.
Strategic Implementation & Best Practices
- Define a North Star Metric: Identify one key metric that correlates with long-term value (e.g., “weekly active users” for a social app). Track all product changes against this metric to maintain strategic focus.
- Implement Event Tracking Early: Use a standardized taxonomy for events (e.g., “signup_completed,” “purchase_initiated”). Avoid over-tracking; focus on actions that map to user journeys and business goals.
- Leverage Funnel and Cohort Analysis: Build funnels for critical flows (onboarding, checkout) to spot drop-off points. Use cohort analysis to compare behavior of users acquired via different channels or time periods.
- Integrate with Experimentation Tools: Connect product analytics with A/B testing platforms (e.g., Optimizely, LaunchDarkly) to measure causal impact of feature changes on user behavior.
- Establish Data Governance: Ensure data accuracy by validating event triggers, deduplicating records, and setting up alerts for anomalies. Clean data is prerequisite for reliable insights.
Common Pitfalls & Strategic Mistakes
One frequent error is vanity metrics obsession—focusing on total downloads or page views instead of actionable metrics like activation rate or time-to-value. This leads to misallocated resources and false signals of product health.
Another pitfall is data silos where product analytics is isolated from marketing or sales data. Without a unified view, teams cannot attribute revenue to specific product features or user behaviors, hindering ROI analysis.
Finally, analysis paralysis occurs when teams collect too much data without clear hypotheses. This results in endless dashboards but no decisions. To avoid this, always start with a specific question (e.g., “Why is churn high in week 2?”) and only track events relevant to that question.
Conclusion
Product Analytics is the backbone of data-driven product development, enabling teams to optimize user experiences, reduce churn, and accelerate growth. By integrating behavioral insights into every strategic decision, organizations can build products that truly resonate with users and outperform competitors in the digital marketplace.