



Key Takeaways
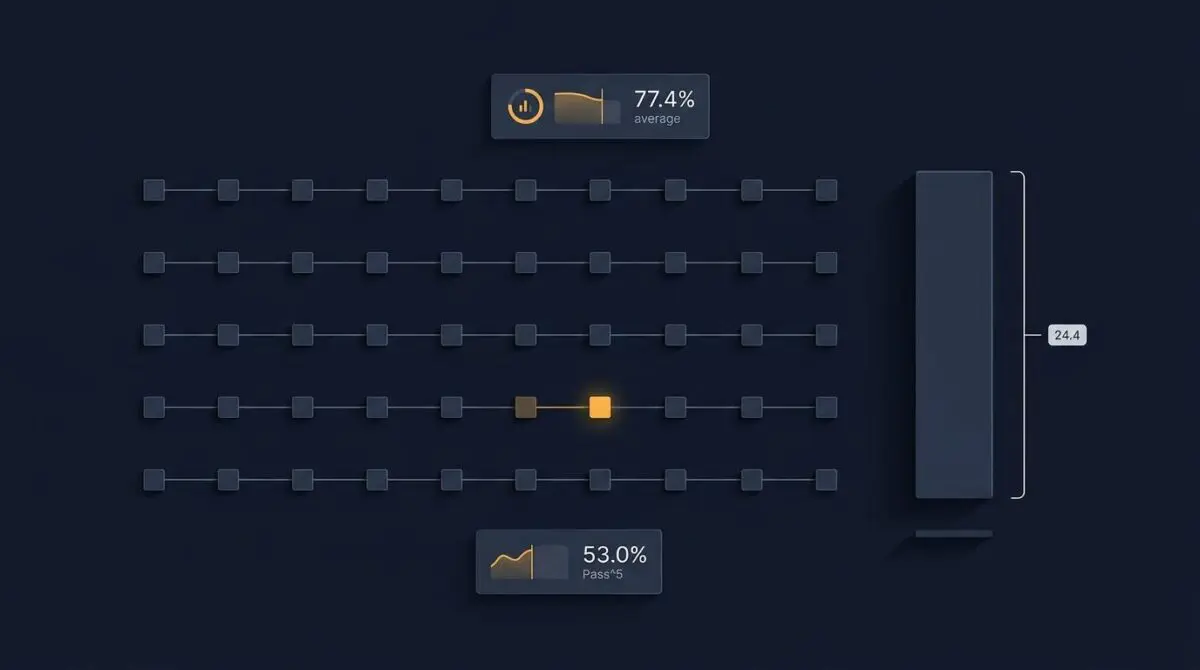
- A GPT-4.1 ReAct agent posted 77.4% average success on AppWorld but only 53.0% Pass^5, a 24.4-point consistency gap.
- The ALTK-Evolve Consistency Analyzer replays each decision point with five completions, flagging flip-prone steps and converting them into reusable guidelines.
- Consistency guidelines lifted Pass^5 to 69.0% and mean accuracy to 81.0%, halving the gap without any loss of capability.
Table of Contents
The 24-Point Gap Hiding Behind Average Accuracy
A technical report posted on the Hugging Face blog describes a reliability problem that most agent benchmarks do not surface.
A GPT-4.1 ReAct agent running on AppWorld achieved 77.4 percent average success over five runs.
When those same tasks were checked for success on all five repetitions, the pass rate fell to 53.0 percent.
The resulting 24.4-point consistency gap separates models that look capable from models that can be depended on.
The Hugging Face report introduces a diagnostic called the Consistency Analyzer and a family of consistency guidelines built into ALTK-Evolve.
Inside the Consistency Analyzer and Guideline Pipeline
Detecting Flip-Prone Decisions
The Consistency Analyzer resamples an agent’s recorded trace without re-running the full task.
It replays each decision point with a single call that requests five completions at once.
That produces a consistency score per step, pinpointing where the model was one token-sample away from making a different choice.
The method is fully black-box, requiring no logits, no model internals, and no ground truth.
The underlying failure mode comes from flat probability distributions over next-token choices.
A sharp distribution repeats reliably; a flat distribution can reorder near-tied tokens under small platform-level perturbations.
Because an agent chains dozens of decisions, a small per-step flip probability compounds into large run-level variability.
Turning Instability Into Guidelines
Each flagged decision becomes a candidate consistency guideline in the standard ALTK-Evolve format.
A real example from an AppWorld task about counting SimpleNote checklist items generated two guidelines: use line-anchored regex matching instead of substring counting, and verify search results before proceeding.
The target is instability, not failure, so the system catches steps that happened to work but could easily flip.
Results: Halving the Gap Without Losing Accuracy
On AppWorld’s test_normal set of 168 tasks, consistency guidelines raised aggregate Pass^5 from 53.0 to 69.0 percent.
Mean accuracy rose from 77.4 to 81.0 percent, narrowing the consistency gap from 24.4 to 12.0 percentage points.
Medium-difficulty tasks gained 22.9 points and hard tasks gained 14.3 points, while easy tasks added 12.2 points.
Mean accuracy never declined at any difficulty level, which the report treats as a hard constraint rather than a side effect.
Applied to a related but different task variant, the guidelines still lifted Pass^5 by 13.0 percentage points.
On the weaker gpt-oss-120b model, same-task Pass^5 rose 6.0 points, while similar-task gains reached 8.7 points, suggesting reusable failure patterns rather than single-trajectory memorization.
Pass^k Is the New Production Gate for AI Agents
The consistency gap is not unique to the AppWorld experiment.
Splunk‘s AI agent evaluation research offers a broader view of the same production problem.
An Agent S3 system built on GPT-5 reached roughly 78 percent pass@10 but only 36 percent pass^10.
That means a user asking the same task repeatedly could expect dependable success only about a third of the time, even when the agent looked broadly capable.
The distinction matters because pass@k asks whether at least one attempt succeeds, while pass^k asks whether every attempt succeeds.
Production workloads effectively experience pass^k, not the optimistic pass@k number shown on many leaderboards.
That research also cites a Gartner forecast predicting that 40 percent of enterprises will demote or decommission autonomous AI agents by 2027.
The prediction ties directly to the gap between single-run capability and repeat-run reliability.
Benchmark instability compounds the problem: rerunning one benchmark 23 times in identical configuration produced scores ranging from 57.9 to 76.8 percent.
Another cited layered evaluation found that injected regressions shifted aggregate pass rates by only 1.7 to 5.9 points while affected slices dropped 25 to 91 points.
The mathematics of chained decisions reinforces the risk.
A ten-step workflow where each step succeeds 95 percent of the time yields only about 60 percent end-to-end reliability.
At 90 percent per step, end-to-end success falls to roughly 35 percent.
Reliability Now Sits Next to Capability
Agent reliability is no longer a secondary metric; it is the threshold above which autonomous systems either ship or get demoted. For teams building AI agent evaluation pipelines that need to scale, programmatic SEO and AI automation is how Andres SEO Expert approaches it — contact the team.
Frequently Asked Questions
What is the consistency gap in AI agent evaluation?
The consistency gap is the difference between an agent’s average success rate across multiple runs and its rate of succeeding on every run. In the Hugging Face ALTK-Evolve report, a GPT-4.1 ReAct agent on AppWorld averaged 77.4 percent success over five runs, but succeeded on all five repetitions only 53.0 percent of the time, producing a 24.4-point gap between apparent capability and dependable reliability.
How does the Consistency Analyzer detect flip-prone decisions?
The Consistency Analyzer replays an agent’s recorded trace without re-running the full task. At each decision point it issues a single call requesting five completions at once, producing a per-step consistency score. The method is fully black-box, requiring no logits, no model internals, and no ground truth, and it flags steps where the model was one token-sample away from choosing differently.
What is the difference between pass@k and pass^k?
Pass@k asks whether at least one attempt out of k succeeds, while pass^k asks whether every attempt succeeds. Splunk’s research found an Agent S3 system built on GPT-5 reached roughly 78 percent pass@10 but only 36 percent pass^10, meaning a user repeating the same task could expect dependable success only about a third of the time even though the agent looked broadly capable.
How much do consistency guidelines improve agent reliability?
On AppWorld’s test_normal set of 168 tasks, consistency guidelines raised aggregate Pass^5 from 53.0 to 69.0 percent while mean accuracy rose from 77.4 to 81.0 percent, narrowing the consistency gap from 24.4 to 12.0 percentage points. Medium-difficulty tasks gained 22.9 points, hard tasks gained 14.3 points, and easy tasks added 12.2 points, with no decline in mean accuracy at any difficulty level.
Why does small per-step instability cause large run-level failures?
Agent failures compound because a single agent chains dozens of decisions. Flat probability distributions over next-token choices allow near-tied tokens to reorder under small platform-level perturbations, so each step carries a small flip probability. In a ten-step workflow where each step succeeds 95 percent of the time, end-to-end reliability is only about 60 percent; at 90 percent per step it falls to roughly 35 percent.
Do consistency guidelines transfer to other models and task variants?
Yes. Applied to a related but different task variant, the guidelines still lifted Pass^5 by 13.0 percentage points. On the weaker gpt-oss-120b model, same-task Pass^5 rose 6.0 points while similar-task gains reached 8.7 points, which suggests the guidelines capture reusable failure patterns rather than memorizing a single trajectory.
Why is pass^k becoming the production gate for AI agents?
Production workloads effectively experience pass^k because users repeat the same task and need every attempt to succeed, not just one. Gartner forecasts that 40 percent of enterprises will demote or decommission autonomous AI agents by 2027, driven by the gap between single-run capability and repeat-run reliability. Benchmark instability reinforces the risk: rerunning one benchmark 23 times in identical configuration produced scores ranging from 57.9 to 76.8 percent.