
Key Takeaways
- AI coding agents now get automatic OpenTelemetry tracing in local Workers — no manual setup required.
- Agents can query Local Explorer API for precise trace data, pinpoint failures, and verify fixes locally.
- Runtime-embedded tracing closes the local-production gap, making AI debugging faster and more reliable.
Table of Contents
Cloudflare Arms AI Coding Agents with Local Trace Intelligence
Cloudflare has shipped a capability that lets AI coding agents automatically capture and query OpenTelemetry traces from local Worker invocations, eliminating the need for manual instrumentation or prompt engineering around observability.
The feature, detailed in an August 4 announcement from the Cloudflare blog, activates silently when wrangler dev or vite dev detects an AI agent session, exposing a Local Explorer API at http://localhost:8787/cdn-cgi/explorer/api where agents can run SQL queries against trace data.
The promise is aggressive: an agent can reproduce an error, query the exact span that failed, inspect correlated console logs, fix the root cause, and verify the solution — all within a single local loop, without ever deploying or adding temporary log statements.
Authors Zin Khant, Nickhil Pattikonda, and Nevi Shah frame it as the natural culmination of years of investment in local development infrastructure, from the introduction of Miniflare to making local mode the default in Wrangler 3.
How Automatic OpenTelemetry Capture Transforms the Debug Loop
The mechanism hinges on instrumentation baked directly into workerd, the open-source runtime powering Cloudflare Workers. No SDK installation, no code changes, and no explicit tracing configuration are required.
The runtime automatically captures spans for three critical categories: all outbound HTTP fetch calls with timing and status codes, every binding interaction across KV, R2, D1, Durable Objects, Queues, and other services, plus the full lifecycle of each invocation from handler entry to completion.
Any custom spans emitted by application code also appear alongside these automatic spans, creating a unified telemetry picture without fragmentation.
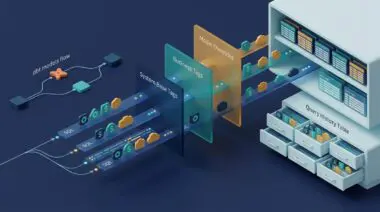
Under the hood, Miniflare collects runtime events and console output, assembles them into OpenTelemetry-compliant traces with correlated logs, and writes the telemetry to an internal SQLite-backed Durable Object that serves as the local trace store.
The Local Explorer API then exposes that data through the local development server. Its root endpoint serves an OpenAPI schema, meaning agents can discover available endpoints at runtime without hardcoded instructions — a design choice that dramatically lowers integration friction.
The contrast with the pre-trace workflow is stark. Without local traces, a 500 error on an endpoint like POST /api/orders gives the agent no indication of which operation failed. The agent resorts to adding log statements around each suspect operation, rerunning the request, inspecting text output, and repeating — a cycle that burns both time and tokens.
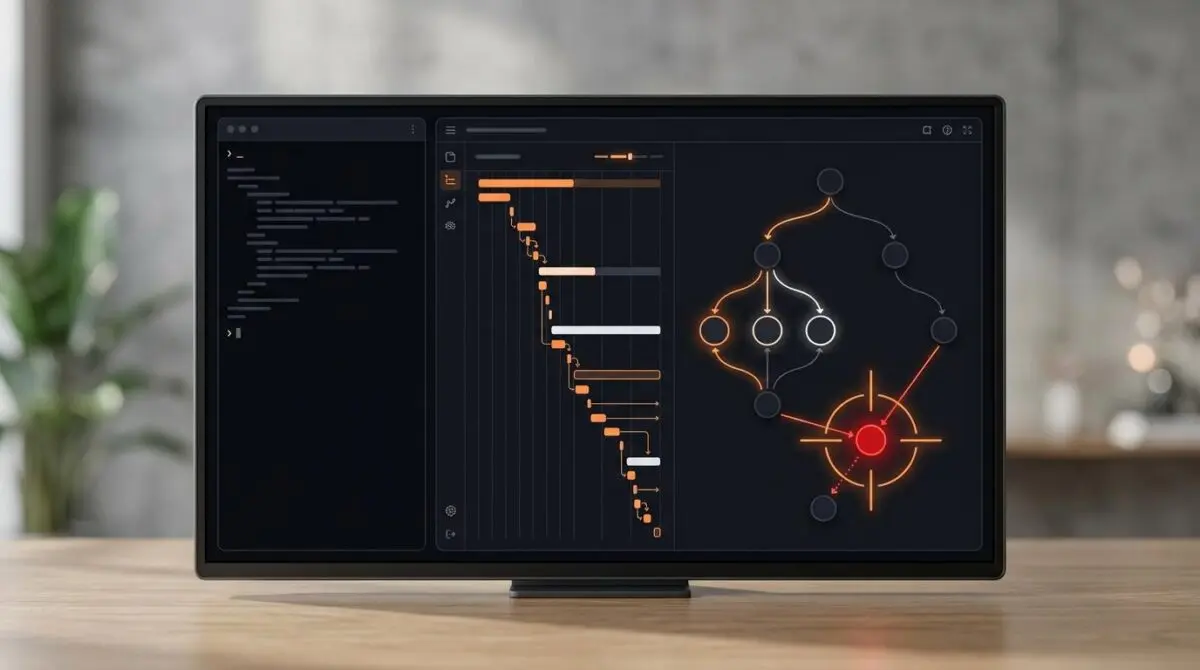
With local traces enabled, the agent reproduces the error once, queries the observability endpoint, and immediately sees the causal chain: the KV read succeeded, the D1 insert failed with a specific schema error, and the Queue message was never dispatched.
POST /api/orders is returning 500. Find the cause, fix it, and verify the fix locally.
The agent then uses the same API to inspect the D1 schema, discovers that a migration exists in the repository but was never applied locally, applies it, and runs the request again. A single local iteration replaces what previously demanded multiple cycles of guesswork.
For human developers, the same telemetry is visualized through the Local Explorer browser interface, accessible by pressing e in Wrangler or visiting /cdn-cgi/explorer on the local server. Developers can browse local binding state, select requests, and inspect spans, timing data, attributes, errors, and correlated console logs — all without leaving localhost.
The Agent Development Lifecycle Gains Production-Grade Observability
This launch, announced on the Cloudflare blog, does not exist in isolation. It arrives alongside a broader suite of Cloudflare announcements across what the company has branded Agents Week, including a tracing product that surfaces every action an AI agent takes and the formalization of an Agent Development Lifecycle framework.
Together, these releases signal a strategic bet that AI coding agents are graduating from experimental tools to production-critical infrastructure, and that their observability needs now mirror — or exceed — those of human engineering teams.
The automatic nature of the trace capture is the architectural decision that matters most. By embedding instrumentation directly in the runtime rather than requiring per-project setup, Cloudflare ensures that every Worker project gains observability by default, regardless of whether a developer remembered to configure it.
This default-on posture eliminates a class of failure where agents operate blindly, making decisions from incomplete information simply because no one thought to wire up tracing for a particular repository.
The OpenAPI-driven discovery mechanism further reduces the cognitive load on agent tooling. Agents do not need pre-programmed knowledge of the Local Explorer API’s endpoints; they can interrogate the schema at runtime and adapt their queries accordingly.
For the broader AI industry, this pattern — runtime-embedded instrumentation plus schema-driven discovery — offers a template for how development infrastructure should evolve to serve both human and machine consumers of telemetry data simultaneously.
The token economics also deserve attention. Every unnecessary debugging cycle an agent executes represents real computational cost. Structured trace data that pinpoints failures in a single query dramatically compresses the token budget required to resolve issues, a consideration that compounds across the millions of agent-driven development sessions likely to emerge in the coming years.
Closing the Gap Between Local Development and Production Confidence
The deeper implication of local tracing is that it collapses the feedback distance between development and production. When agents can access the same class of structured telemetry locally that observability platforms provide post-deployment, the traditional justification for shipping code to test it weakens considerably.
This shift matters for teams that have invested heavily in AI-assisted development pipelines. An agent that can verify fixes with production-grade trace data before opening a pull request operates at a fundamentally higher reliability tier than one that can only check for error status codes.
The Local Explorer API also exposes state inspection capabilities across D1, KV, R2, Durable Objects, and Workflows, meaning agents can correlate trace data with the actual contents of bindings — a capability that transforms debugging from a linear log-parsing exercise into a multidimensional investigation.
For engineering leaders evaluating the maturity of AI coding tooling, the presence or absence of structured local observability should now register as a hard requirement rather than a nice-to-have. Agents without access to trace data are functionally debugging with one hand tied behind their back.
As AI-driven development workflows continue their rapid professionalization, infrastructure decisions made today around observability will compound into either structural advantages or persistent blind spots. Cloudflare’s bet is that default-on, runtime-level instrumentation represents the only scalable path forward.
Organizations building on AI-augmented development pipelines face a similar calculus: the quality of their agents’ output will increasingly reflect the quality of the telemetry those agents can access. If your infrastructure serves AI coding tools the same sparse error messages a human developer would squint at, the ceiling on autonomous debugging capability stays low regardless of how advanced the underlying model becomes. Investing in structured observability at every layer — and making it queryable by both humans and machines — is rapidly becoming table stakes for serious AI development operations.
For teams looking to architect high-performance AI automation workflows that integrate seamlessly with cloud infrastructure, programmatic AI automation and pipeline engineering can help bridge the gap between raw agent capability and production-ready reliability. Those evaluating how their hosting environment impacts agent-driven development velocity may also benefit from infrastructure tuned for modern cloud workloads. To explore how these capabilities fit your specific technical landscape, reach out to Andres or learn more about the engineering philosophy behind Andres SEO Expert.
Frequently Asked Questions
What is Cloudflare’s new local tracing feature for AI coding agents?
Cloudflare has introduced a feature that allows AI coding agents to automatically capture and query OpenTelemetry traces from local Worker invocations. It activates when wrangler dev or vite dev detects an AI agent session, exposing a Local Explorer API at http://localhost:8787/cdn-cgi/explorer/api where agents can run SQL queries against trace data without manual instrumentation or prompt engineering.
How does Cloudflare automatically capture OpenTelemetry traces in local development?
The capture mechanism is baked directly into workerd, the open-source runtime powering Cloudflare Workers. No SDK installation or code changes are needed. The runtime automatically captures spans for outbound HTTP fetch calls, binding interactions across KV, R2, D1, Durable Objects, Queues, and other services, plus the full lifecycle of each invocation. Miniflare collects these runtime events and console output, assembles them into OpenTelemetry-compliant traces with correlated logs, and stores them in a SQLite-backed Durable Object.
How can AI coding agents use the Local Explorer API to debug Workers?
Agents can access the Local Explorer API at http://localhost:8787/cdn-cgi/explorer/api, which serves an OpenAPI schema at its root endpoint. This allows agents to discover available endpoints at runtime without hardcoded instructions. They can run SQL queries against the trace data to reproduce an error, identify the exact span that failed, inspect correlated console logs, fix the root cause, and verify the solution within a single local loop.
What types of spans does Cloudflare automatically capture in workerd?
The runtime automatically captures spans for three critical categories: all outbound HTTP fetch calls with timing and status codes, every binding interaction across KV, R2, D1, Durable Objects, Queues, and other services, and the full lifecycle of each invocation from handler entry to completion. Custom spans emitted by application code also appear alongside these automatic spans, creating a unified telemetry picture.
How does local tracing reduce debugging time and token costs for AI agents?
Without local traces, an agent facing a 500 error resorts to adding log statements around suspect operations, rerunning requests, and inspecting text output. With local traces, the agent reproduces the error once, queries the observability endpoint, and immediately sees the causal chain, such as a specific D1 schema error. This dramatically compresses the token budget required to resolve issues and replaces multiple guesswork cycles with a single local iteration.
What is the role of the Local Explorer browser interface for human developers?
For human developers, the same telemetry is visualized through the Local Explorer browser interface, accessible by pressing ‘e’ in Wrangler or visiting /cdn-cgi/explorer on the local server. Developers can browse local binding state, select requests, and inspect spans, timing data, attributes, errors, and correlated console logs entirely within localhost.
How does this feature relate to Cloudflare’s Agents Week announcements?
The launch is part of Cloudflare’s Agents Week, alongside a tracing product that surfaces every action an AI agent takes and the formalization of an Agent Development Lifecycle framework. Together, these releases signal a strategic bet that AI coding agents are becoming production-critical infrastructure, requiring observability that mirrors or exceeds that of human engineering teams.