




Key Takeaways
- System tags auto-injected by the dbt-databricks adapter give every model run out-of-the-box technical metadata.
- Profile-level and model-level tags layer on team, cost center, and environment, creating a complete audit trail.
- Granular cost visibility becomes non-negotiable for AI infrastructure, enabling precise attribution of compute-hungry model iterations.
Table of Contents
Eighty Identical Rows in Your Query Log Just Became Actionable Intelligence
Your dbt project runs dozens of models nightly, the warehouse bill has doubled, and finance wants to know which team owns the spend.
You open the query history and every row reads the same generic label.
Databricks reports that its Query Tags feature eliminates this exact scenario by enriching every SQL statement with customizable metadata — no code changes required in existing transformation models.
Auto-injected tags capture the model name, materialization type, and adapter version.
User-defined tags layer on business context: team ownership, cost center codes, project identifiers, and environment markers.
All of it lands in a single system table, turning cost attribution from a forensic scavenger hunt into a straightforward SQL query.
Tag every dbt query with team, cost center, project, and environment — zero code changes to your SQL models
The implications for data teams running AI workloads are immediate and far-reaching.
When training pipelines, feature engineering jobs, and inference batches all share warehouse infrastructure, knowing exactly which model consumed what resources stops being a luxury.
How Three Layers of Tagging Create a Complete Audit Trail
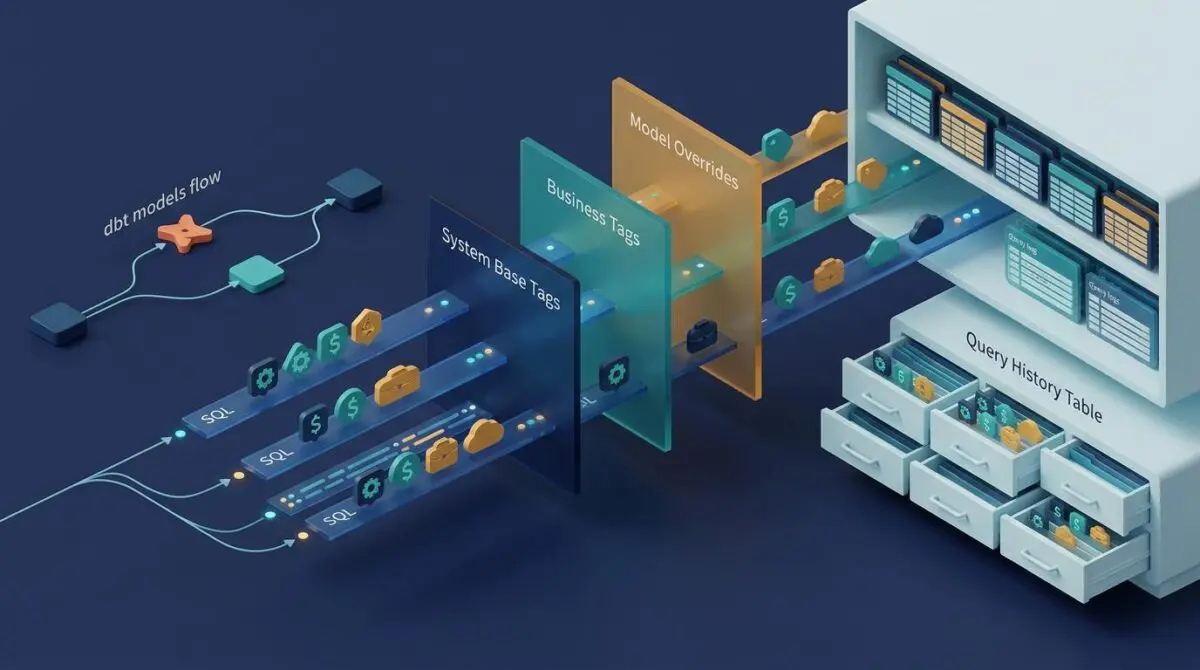
The tagging architecture operates at three levels, each building on the previous one to create progressively richer metadata.
At the foundation, the dbt-databricks adapter automatically injects four system tags for every model execution: the model name, the materialization strategy, the dbt-core version, and the adapter version itself.
This means per-model visibility exists out of the box with zero configuration effort from the data team.
The second layer sits at the profile level, where a single query_tags field in the dbt profile attaches consistent business dimensions — team, cost center, project name, and environment — to every query the project generates.
One configuration line propagates across an entire pipeline.
The third layer, model-level tagging, handles exceptions and edge cases.
When a specific model needs different ownership metadata or belongs to a distinct cost center, tags defined in dbt_project.yml or the model SQL definition override profile-level values for that model alone.
All three layers converge in the system.query.history table, where the query_tags column stores them as a structured map.
Standard SQL map-access syntax extracts individual tags into separate columns ready for aggregation, filtering, and dashboard visualization.
The Query History UI and SQL Warehouse Monitoring UI both surface these tags directly in the Query Profile panel, giving operators at-a-glance context without writing a single SELECT statement.
For teams adopting the newer metric views materialization available through dbt-databricks 1.12 and later, the same query_tags configuration parameter applies.
A critical distinction exists here: query_tags track the SQL statements that create or refresh metric views, while databricks_tags govern Unity Catalog object-level metadata for discovery and governance.
One targets operational observability; the other targets data discoverability.
Granular Observability Is Becoming Non-Negotiable for AI Infrastructure
The release of Query Tags arrives at a moment when data teams supporting AI workloads face unprecedented pressure to justify infrastructure costs.
Foundation model fine-tuning, retrieval-augmented generation pipelines, and continuous embedding refreshes all consume warehouse compute in ways that traditional analytics workloads never did.
Without per-model attribution, the cost of these AI-specific operations remains invisible inside shared infrastructure, making it impossible to calculate the true operational expense of maintaining production AI systems.
What distinguishes this tagging approach from traditional monitoring is its integration directly into the transformation layer rather than requiring separate instrumentation tooling.
Data teams already using dbt for transformation logic get observability as a side effect of adapter configuration, not as a parallel implementation effort.
This pattern — embedding operational metadata at the execution layer rather than bolting it on afterward — mirrors broader industry shifts toward platform-native observability.
The reference implementation’s self-monitoring dashboard, which queries its own pipeline costs from the same system tables, demonstrates what fully instrumented data operations look like in practice.
When the pipeline that analyzes billing data also tracks its own compute consumption, the feedback loop between optimization effort and measured result collapses to near-zero latency.
For AI engineering teams, this capability becomes particularly valuable during model iteration cycles where compute profiles shift rapidly.
A fine-tuning run that suddenly consumes disproportionate resources is immediately attributable to a specific model and team, rather than surfacing days later as an unexplained spike in the aggregate bill.
The best practices emerging from early adopters emphasize consistency over granularity: define organization-wide tags at the profile level and reserve model-level overrides for genuine exceptions.
Tagging the environment — distinguishing local development queries from staging and production runs — proves especially critical for separating experimental work from operational costs in analytics.
The auto-injected tags already handle technical metadata, so custom tags should focus exclusively on business context that the adapter cannot infer.
From Opaque Pipelines to Fully Instrumented Operations
The gap between running a data pipeline and understanding its cost profile has been a persistent friction point for engineering teams managing AI infrastructure at scale.
Query Tags close that gap by moving attribution metadata into the execution layer itself, making cost visibility an inherent property of the pipeline rather than a separate analytics project.
The reference project’s finding that four mart tables accounted for 92 percent of total compute time illustrates precisely why this visibility matters: without it, optimization efforts scatter across all models equally instead of concentrating on the handful that actually move the needle.
For teams building AI-driven data infrastructure, the principles that make Query Tags effective — automation, layered configuration, and operator-accessible visibility — extend well beyond any single platform feature.
Andres SEO Expert brings the same engineering discipline to site performance engineering, cloud infrastructure optimization, and AI-powered automation workflows, ensuring that technical systems don’t just run but remain observable, attributable, and continuously improvable. Whether you’re instrumenting data pipelines for cost transparency or architecting high-performance digital infrastructure that scales with precision, the methodology stays constant: build observability into the execution layer from the start.
Connect with Andres to discuss how technical optimization and infrastructure strategy can transform your digital operations, explore AI automation and pipeline engineering, evaluate cloud infrastructure solutions, or audit your site performance architecture.
Frequently Asked Questions
What are Databricks Query Tags for dbt pipelines?
Databricks Query Tags enrich every SQL statement with customizable metadata, such as model name, materialization type, team, cost center, project, and environment, without requiring code changes to existing dbt models. They turn raw query history into actionable cost attribution data.
How do auto-injected and custom query tags create an audit trail?
Auto-injected tags capture technical metadata like model name and materialization strategy, while custom profile-level and model-level tags add business context like ownership and cost center. All three layers converge in the system.query.history table, creating a complete audit trail for every query.
Which query tags are automatically injected by the dbt-databricks adapter?
The dbt-databricks adapter automatically injects four system tags for every model execution: the model name, the materialization strategy, the dbt-core version, and the adapter version. This provides out-of-the-box per-model visibility with zero configuration.
How do I add team, cost center, project, and environment tags to dbt queries?
Set a single query_tags field at the profile level to attach consistent business dimensions to every query in the project. For exceptions, define model-level tags in dbt_project.yml or the model SQL definition to override profile-level values for that model only.
How do Databricks Query Tags help with AI workload cost attribution?
AI workloads like fine-tuning, RAG pipelines, and embedding refreshes consume warehouse compute inside shared infrastructure. Query Tags make those costs visible per model and team, so sudden compute spikes can be attributed immediately instead of appearing as unexplained aggregate bill increases.
What is the difference between query_tags and databricks_tags for metric views?
query_tags track the SQL statements that create or refresh metric views and are used for operational observability. databricks_tags govern Unity Catalog object-level metadata for discovery and governance, so one targets pipeline cost tracking while the other targets data discoverability.
Where can query tags be viewed for monitoring and analysis?
Query tags appear in the system.query.history table as a structured map, and standard SQL map-access syntax can extract individual tags for dashboards. They are also visible in the Query Profile panel of the Query History UI and SQL Warehouse Monitoring UI.