


Key Takeaways
- Production AI agents require full execution visibility — traces, spans, and structured logs — to be debuggable.
- Carry trace context across services and configure error workflows that automatically alert on failure.
- Pair deep trace visibility with pre-execution governance to catch data-layer failures and block risky actions.
Table of Contents
- Production AI Agents Are Now Too Complex to Debug Without Full Execution Visibility
- From Execution IDs to Error Workflows: The Telemetry Stack That Makes Agents Explainable
- The Market Shift: Governance and Data-Layer Failures Are Redrawing Observability
- Why Automation Teams Should Treat Observability as Pre-Execution Architecture
Production AI Agents Are Now Too Complex to Debug Without Full Execution Visibility
AI agents now handle multi-step work across models, tools, and external APIs, but when a request fails, knowing that it failed is no longer enough. A new implementation guide from the n8n engineering team, published on August 14, 2026, argues that production teams need complete execution visibility: traces, metrics, and structured logs that reveal exactly what an agent did, which tool it called, and why a decision produced an unexpected result.
Traditional infrastructure monitoring can confirm that a server is healthy, yet it cannot explain why two identical agent requests produced different outcomes. That gap has made agent observability a core engineering requirement for automation teams in 2026.
From Execution IDs to Error Workflows: The Telemetry Stack That Makes Agents Explainable
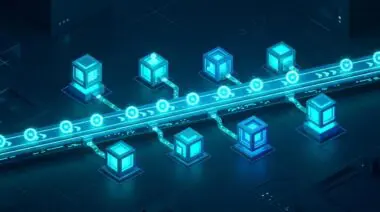
The observability model outlined in the implementation guide separates agent telemetry into three layers. Traces capture the complete execution path, spans isolate each model call or tool invocation, and logs supply the runtime context needed to reconstruct failures.
That structure matters because production agents do not follow a fixed execution path. The same task can trigger different retrieval steps, API requests, or fallback branches depending on the model’s reasoning at runtime.
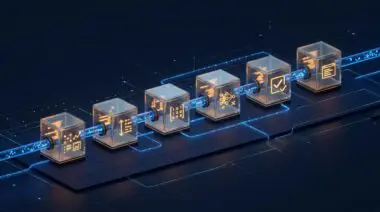
A practical implementation starts at the agent entry point. Every execution should receive a unique identifier that acts as the root span for the entire workflow, making it possible to correlate downstream model calls, tool actions, and logs to a single run.
From there, each LLM invocation, retrieval operation, API request, and tool call becomes a child span. Without that level of instrumentation, a failed execution often collapses into a single opaque error.
Structured logs should stream in real time. The n8n engineering guide points to log stream features that send node-level execution data to platforms such as Datadog Logs, Grafana Loki, or cloud storage for longer-term analysis.
Trace context must propagate across services. When an agent hands work to an external API or an asynchronous process, carrying the same OpenTelemetry correlation header keeps the execution connected across system boundaries.
Error workflows close the loop. Instead of waiting for users to report a problem, teams can configure automatic notifications or recovery workflows that trigger the moment an execution fails.
- Instrument the entry point: create a root span with a unique execution identifier.
- Create child spans: track every model call, tool invocation, and retrieval step.
- Stream structured logs: collect prompts, responses, tool outputs, and errors in real time.
- Propagate context: pass trace headers across external services and asynchronous jobs.
- Configure error workflows: trigger alerts and recovery paths before users notice a problem.
The guide also catalogues a crowded tooling landscape. Langfuse offers open source customization but requires deployment; LangSmith delivers strong tracing but remains tightly coupled to the LangChain ecosystem; Arize AI targets larger ML deployments; Datadog LLM Observability extends existing Datadog instrumentation; and the orchestration platform’s workflow layer provides node-level execution data that complements dedicated observability platforms.
No single tool tells the whole story. Production agents need an orchestration layer that makes workflow execution visible, captures errors, and routes telemetry to dedicated observability platforms.
Production readiness also depends on tuning the observability pipeline itself. The guide recommends setting sampling rates before deployment, tracking token consumption as a cost and complexity signal, and reviewing execution data regularly to catch recurring failure patterns.
Unexpected increases in token usage often indicate prompt drift, inefficient tool calls, or workflows that have become more complex than intended. The guide also draws a sharp line between observability and evaluation: observability tells a team how an agent behaved, while evaluation determines whether that behavior was correct.
The Market Shift: Governance and Data-Layer Failures Are Redrawing Observability
Monte Carlo‘s recent analysis challenges the build-heavy approach. It argues that open source observability works well in early development, but production-scale systems often face fragmented tooling, detection without root-cause resolution, and a heavy maintenance burden as agent count grows.
The same analysis warns that many agent failures are data failures in disguise: stale context, broken upstream tables, or silent schema changes can drive incorrect outputs even when the model itself behaves as designed.
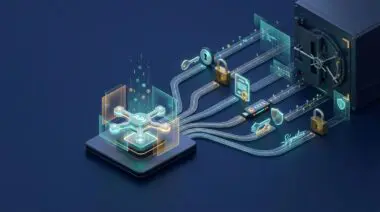
Deloitte pushes the conversation further with a pre-execution governance model called the Agent Action Enforcement Layer. Its approach evaluates and controls agent actions before they touch critical systems or sensitive data.
- Standardized action plans: agent workflows represented as directed acyclic graphs.
- Policy-aware evaluation: compliance, security, and operational constraints checked pre-execution.
- Action-scoped authorization tokens: permissions tied to specific agent actions.
- Non-bypass execution gateway: no action reaches critical systems without passing the control point.
Performance data adds another layer of competitive friction. A comparative benchmark of four observability tools recorded overhead ranging from near zero for LangSmith to roughly 15 percent for Langfuse, with AgentOps and Laminar falling in between.
The benchmark disclosed sponsor relationships, so the numbers should be read as directional rather than definitive. Even so, the spread highlights how much instrumentation depth and framework integration can affect production latency.
For automation teams, the strategic tension is clear. Workflow-level instrumentation treats observability as something woven into every execution, while managed oversight and pre-execution controls focus on stopping bad actions before they happen.
A production AI agent that can trace every action but never blocks a bad action still creates risk. A governance layer that controls actions but lacks deep tracing will struggle to explain failures after the fact.
The market is moving toward a layered approach: workflow-level execution visibility for debuggability, and policy-aware enforcement for trust. Automation professionals who treat these as separate silos may end up with an observability gap exactly where it matters most.
Why Automation Teams Should Treat Observability as Pre-Execution Architecture
The automation teams that win in production will instrument agent workflows before the first incident, not after, and they will pair deep trace visibility with governance controls that stop bad actions before they touch critical systems. For teams building production AI agent observability pipelines that need to scale without losing visibility, programmatic SEO and AI automation is how Andres SEO Expert approaches it — talk to the team.
Frequently Asked Questions
Why is observability important for production AI agents?
AI agents execute multi-step work across models, tools, and external APIs, so knowing that a request failed is no longer enough. Traditional infrastructure monitoring can confirm a server is healthy, but it cannot explain why two identical agent requests produced different outcomes; full execution visibility shows what the agent did, which tool it called, and why a decision produced an unexpected result.
What are the three layers of agent telemetry?
Traces capture the complete execution path, spans isolate each model call or tool invocation, and logs supply the runtime context needed to reconstruct failures. Together they make production agents explainable when execution paths vary across identical tasks.
How do you implement observability for AI agents?
Start at the agent entry point by creating a root span with a unique execution identifier, then create child spans for every model call, tool invocation, retrieval step, and API request. Stream structured logs in real time, propagate trace context across external services, and configure error workflows that trigger alerts or recovery actions the moment an execution fails.
What is the difference between observability and evaluation?
Observability tells a team how an agent behaved by capturing trace data and logs, while evaluation determines whether that behavior was correct. Both are needed, but they answer different questions about production readiness.
What are common data-layer failures in AI agents?
Many agent failures are data failures in disguise: stale context, broken upstream tables, or silent schema changes can drive incorrect outputs even when the model itself behaves as designed. Observability must therefore watch data inputs and dependencies, not only model calls.
How can teams prevent bad agent actions in production?
Teams can pair workflow-level execution visibility with pre-execution governance controls such as the Agent Action Enforcement Layer. That approach uses standardized action plans, policy-aware evaluation, action-scoped authorization tokens, and a non-bypass execution gateway to block bad actions before they touch critical systems or sensitive data.