



Key Takeaways
- AI agents fail silently. Apply the five-stage reliability lifecycle: controls, debugging, evaluation, metrics, and monitoring.
- Observability overhead varies sharply: benchmarks show near-zero latency with LangSmith and up to 15% with Langfuse—measure first.
- Combine offline evaluation with live monitoring to catch agent drift without adding production latency.
Table of Contents
Silent Failures Are Stalling Production AI Agents
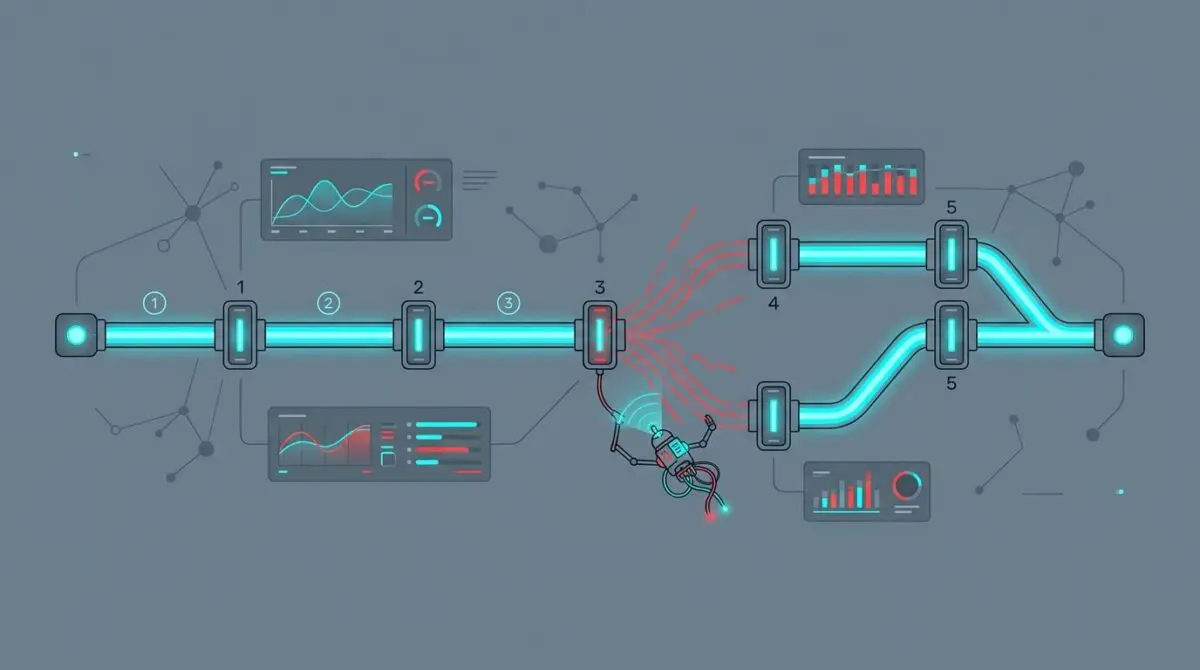
Today, a production reliability framework from the n8n blog confronts a hard truth: AI agents rarely fail with a clean error message. The framework splits reliability into five stages—controls, debugging, evaluation, metrics, and monitoring—so teams can find the exact layer where an agent went wrong.
That structure matters because production agents drift even when prompts, tools, and models stay frozen. New user patterns, shifting external API responses, and growing conversation histories all change agent behavior in ways that deterministic workflow logic never had to account for.
Inside the Five-Stage Reliability Lifecycle
The framework starts with reliability controls, not with more debugging after the fact.
Most failures stem from the context an agent receives rather than a lack of model capability. n8n translates this insight into concrete workflow decisions: configuring the AI Agent node, placing Guardrails and IF/Switch nodes for conditional routing, and scoping tools per workflow stage.
Debugging then shifts from error logs to reasoning-chain inspection.
- Execution tagging: the Execution Data node marks runs so engineers can isolate the right execution among hundreds.
- Built-in traces: agent logs expose what the model saw and decided at each step.
- External tracing: LangSmith and Langfuse provide cost and latency analysis at the token level for self-hosted deployments.
Evaluation follows a small but disciplined testing loop. Run evaluations after every prompt or tool change, seed the dataset with real production failures, and combine offline drift checks with online issue detection.
Metrics are then organized into four categories: execution, quality, efficiency, and safety. The telemetry that fits a prototype will not satisfy an agent serving thousands of users, so the guidance is deliberately minimal—track only the numbers that will change a decision.
Monitoring closes the loop with two visibility layers. Operational dashboards track system health, while behavioral monitoring shows how agent decision-making shifts over time.
In practice, n8n surfaces execution metrics through its Insights dashboard and exposes operational data through a Prometheus endpoint for system-health monitoring.
Quality tracking runs through the platform’s Evaluations feature. Efficiency and safety require targeted instrumentation with the Execution Data node, Guardrails node, and Data Tables.
Observability Overhead Is Now a Benchmarking Battleground
Not all observability is free.
An AIMultiple benchmark of 15 AI agent observability platforms measured instrumentation overhead by running 100 identical queries through a multi-agent travel planning system and comparing latency against a no-instrumentation baseline. The test used Claude 4 Haiku via OpenRouter and the same server infrastructure for each platform.
The results were stark. LangSmith stayed near the baseline with roughly 0% overhead, Laminar added 5%, AgentOps added 12%, and Langfuse added 15%.
AIMultiple attributes the spread to instrumentation depth, event amplification in multi-step pipelines, inline evaluation and validation, and how frequently each platform serializes and persists data. Langfuse’s deeper step-level instrumentation coincided with the highest measured overhead, while LangSmith’s lighter trace artifacts and tighter integration kept it near baseline.
The methodology is public, but the publication also discloses that Weights & Biases is among its benchmarking service subscribers. That does not invalidate the test, but it is a caveat automation teams should hold alongside the numbers.
For n8n users, the tension is immediate. Built-in Insights and Prometheus endpoints remove the need to ship telemetry to an external platform for basic operational monitoring.
But teams that want token-level reasoning traces from Langfuse may be signing up for a 15% latency penalty on top of their agent workflows. In high-volume automation estates, that penalty compounds quickly.
Evaluation Metrics That Scale With Agent Complexity
DeepEval’s metric taxonomy gives automation teams a sharper way to align evaluation with what an agent actually does. It splits metrics into three layers: reasoning, action, and execution.
For agents with explicit planning, PlanQuality and PlanAdherence scores measure whether the plan matches the task and whether execution follows that plan. For tool-calling agents, ToolCorrectness and ArgumentCorrectness scores evaluate whether the right tools were used and whether the generated parameters were valid.
For complex multi-step workflows, TaskCompletion and StepEfficiency scores judge whether the outcome matched the goal and whether the execution path was unnecessarily long. All metric scores now follow a higher-is-better convention, and DeepEval states that production scoring can run asynchronously on exported traces to avoid adding latency.
That asynchronous pattern fits the evaluation discipline automation teams need. A small test dataset should cover critical paths, and every real production failure should be folded back into that dataset.
Offline evaluation catches agent drift after updates. Online evaluation finds issues that only emerge from live data.
The combination matters because a metric that cannot run continuously in production is just a periodic audit.
Why Automation Teams Need Decision-Grade Telemetry
The next wave of production AI agents will not be judged by model quality alone.
They will be judged by whether teams can trace a bad decision, measure its cost, and stop it from repeating without adding unacceptable latency.
For automation teams building production AI agent pipelines that need to scale, programmatic SEO and AI automation is how Andres SEO Expert approaches it — contact us.
Frequently Asked Questions
What are the five stages of the AI agent reliability lifecycle?
The framework splits reliability into five stages: controls, debugging, evaluation, metrics, and monitoring. These stages help teams identify the exact layer where an agent went wrong, from setting reliability controls to closing the loop with monitoring.
Why do AI agents fail silently in production?
AI agents rarely fail with a clean error message because they drift even when prompts, tools, and models stay frozen. New user patterns, shifting external API responses, and growing conversation histories change agent behavior in ways that deterministic workflow logic never had to account for.
How much latency overhead does observability add to AI agents?
An AIMultiple benchmark of 15 platforms found that LangSmith stayed near baseline with roughly 0% overhead, while Laminar added 5%, AgentOps added 12%, and Langfuse added 15%. The spread is attributed to instrumentation depth, event amplification, and how frequently each platform serializes and persists data.
What metrics should teams track to evaluate AI agent performance?
DeepEval’s taxonomy splits metrics into reasoning, action, and execution layers. For planning agents, PlanQuality and PlanAdherence measure plan quality; for tool-calling agents, ToolCorrectness and ArgumentCorrectness evaluate tool usage; and for multi-step workflows, TaskCompletion and StepEfficiency judge outcome and path efficiency. All metrics follow a higher-is-better convention.
What is the difference between operational monitoring and behavioral monitoring?
Operational dashboards track system health and are often exposed through endpoints like Prometheus, while behavioral monitoring shows how agent decision-making shifts over time. Both are necessary: operational monitoring catches system failures, and behavioral monitoring catches drift in agent choices.
How can teams reduce observability overhead in production AI agents?
Teams can use built-in tools like n8n’s Insights dashboard and Prometheus endpoints for basic operational monitoring without external telemetry. For deeper tracing, they should weigh the latency penalty—such as Langfuse’s 15% overhead—and target external instrumentation only to decision-grade traces that will change a decision.