


Executive Summary
- Sentry is a real-time error tracking and performance monitoring platform that provides deep visibility into application health and user experience.
- It enables developers to identify, prioritize, and resolve front-end and back-end bottlenecks that directly degrade Core Web Vitals.
- By utilizing distributed tracing and breadcrumbs, Sentry bridges the gap between raw server logs and actual client-side performance metrics.
What is Sentry?
Sentry is an open-source, cloud-based application monitoring platform designed to provide developers with real-time insights into software errors and performance regressions. Unlike traditional logging systems that record events linearly, Sentry captures the entire context of an exception or performance bottleneck, including the stack trace, environment variables, and user actions leading up to the event. This allows for rapid debugging and proactive optimization of complex web architectures.
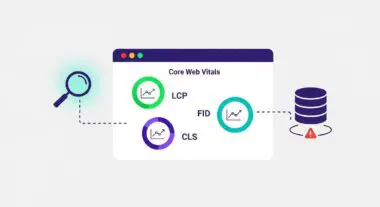
In the context of website performance engineering, Sentry functions as a robust observability layer. It tracks distributed transactions across the stack—from the client-side browser environment to the server-side API and database layers. By aggregating this data, Sentry provides actionable metrics such as Largest Contentful Paint (LCP), First Input Delay (FID), and Cumulative Layout Shift (CLS), mapped directly to the specific code commits or infrastructure changes that caused them.
The Real-World Analogy
Imagine a high-speed automated factory where thousands of products are assembled every minute. If a single machine malfunctions or slows down, it could compromise the entire production line. Sentry acts like a sophisticated network of high-definition sensors and a black box flight recorder installed throughout the factory. Instead of just knowing that a product failed, the system tells you exactly which bolt was loose, which robotic arm moved too slowly, and what the environmental conditions were at that precise millisecond, allowing the engineers to fix the root cause before the entire line grinds to a halt.
Why is Sentry Critical for Website Performance and Speed Engineering?
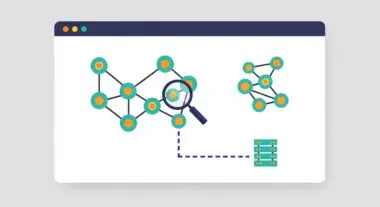
Sentry is critical because it transforms passive error logging into active performance observability. For modern web applications, performance is not a static metric but a dynamic state influenced by third-party scripts, network latency, and client-side execution. Sentry’s performance monitoring capabilities allow engineers to visualize the waterfall of transactions, identifying slow-loading resources or inefficient database queries that increase Time to First Byte (TTFB) and overall page load times.
Furthermore, Sentry’s integration with Core Web Vitals provides a direct feedback loop for SEO and user experience. By correlating performance spikes with specific releases, teams can implement performance budgets and ensure that new features do not inadvertently increase the Total Blocking Time (TBT). This granular visibility is essential for maintaining high-performance scores in competitive AI-search and GEO environments where speed is a primary ranking factor.
Best Practices & Implementation
- Implement Sampling Rates: To avoid excessive data volume and performance overhead, configure transaction sampling rates (tracesSampleRate) to capture a representative subset of user sessions rather than every single interaction.
- Upload Source Maps: Ensure that JavaScript source maps are uploaded to Sentry during the build process. This allows the platform to de-obfuscate minified code, mapping errors back to the original source code for faster resolution.
- Utilize Breadcrumbs: Enable automatic breadcrumb tracking to record the sequence of events (DOM interactions, XHR requests, console logs) leading up to a performance issue, providing critical context for reproduction.
- Set Up Performance Alerts: Configure threshold-based alerts for Core Web Vitals to notify the engineering team immediately when LCP or CLS metrics exceed acceptable limits in production.
Common Mistakes to Avoid
One frequent error is the failure to filter sensitive user data (PII), which can lead to compliance issues and bloated log sizes. Another common mistake is ignoring the noise generated by third-party browser extensions or legacy scripts, which can obscure genuine performance bottlenecks. Finally, many organizations fail to integrate Sentry with their CI/CD pipeline, missing the opportunity to automatically link errors to specific code deployments.
Conclusion
Sentry is an indispensable tool for modern performance architects, providing the deep observability required to maintain optimal Core Web Vitals and server-side efficiency. By integrating real-time error tracking with performance monitoring, brands can ensure a seamless, high-speed user experience.