


Key Points
- Consolidating observability tools into a unified OpenTelemetry-native platform eliminates tool sprawl and drastically reduces Mean Time To Resolution.
- Implementing edge filtering and custom telemetry collectors prevents runaway ingestion costs by dropping redundant logs before they reach the backend.
- The future of system health relies on AI-driven autonomous IT, where intelligent agents consume telemetry to trigger self-healing actions instantly.
Table of Contents
- The Invisible Cost of Fragmented Visibility
- The Real-World Data Driving Telemetry Decisions
- Escaping the Trap of Fragmented Dashboards
- Leveraging Artificial Intelligence for Root Cause Analysis
- Reclaiming Budgets from Redundant Ingestion Models
- Commoditizing Telemetry Through Open Standards
- Shifting to Observability-as-Code for Better Adoption
- Transitioning Toward Autonomous IT and Self-Healing Systems
- The Agentic Future of System Health
The Invisible Cost of Fragmented Visibility
Every minute an engineering team spends manually correlating logs across disconnected systems acts as a hidden tax on organizational velocity. This visibility gap widens rapidly as microservices scale beyond human control. Such operational friction creates a massive observability tax, forcing companies to pay exorbitant data ingestion fees without reducing Mean Time To Resolution.
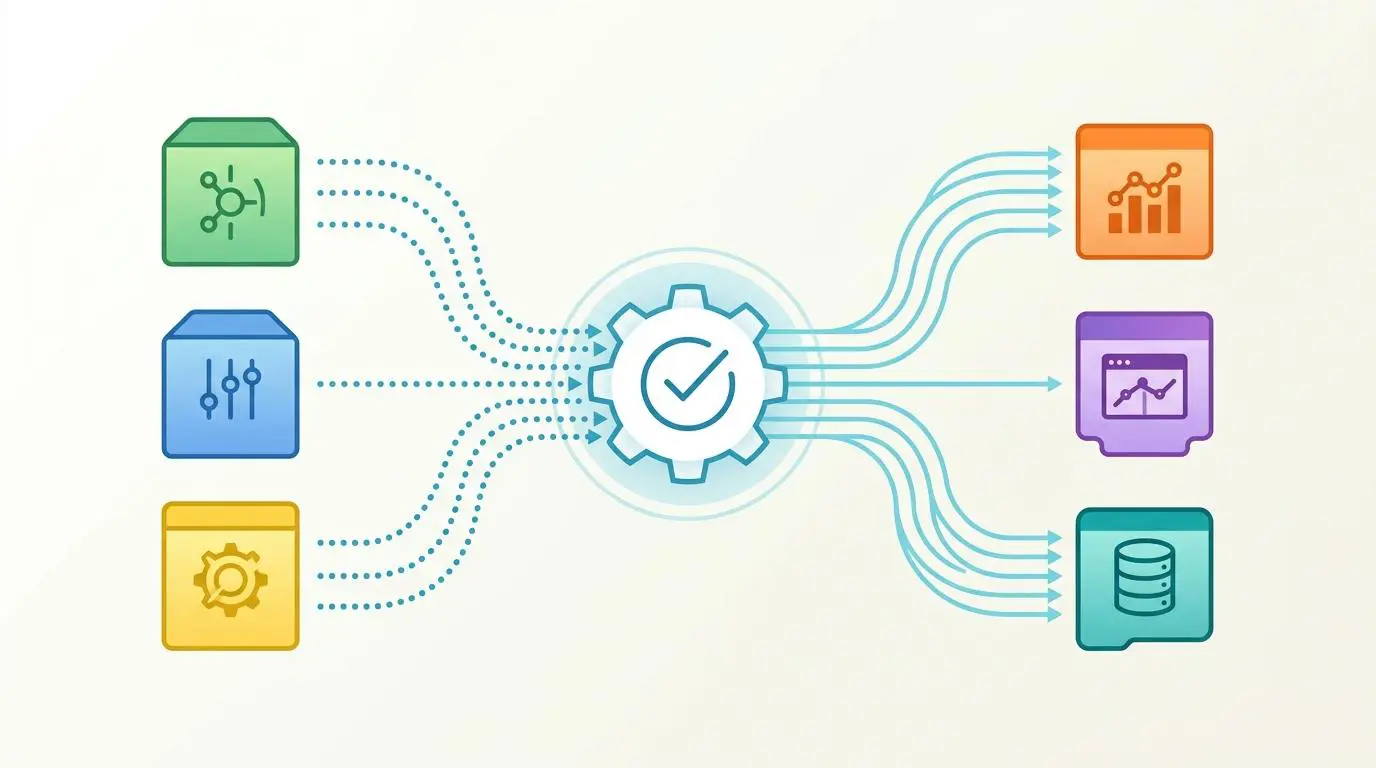
To modernize and secure complex architectures, forward-thinking teams are deploying OpenTelemetry-native unified observability. This approach fundamentally shifts how health data is collected, processed, and understood across the cloud. Consolidating fragmented signals into a single source of truth allows businesses to scale operations without the headache of blind spots.
The Real-World Data Driving Telemetry Decisions
Market Intelligence & Data
OTel Standardization
According to a 2026 Byteiota analysis, OpenTelemetry has reached 95% adoption for all new cloud-native instrumentation projects, effectively ending the era of proprietary agents.
FinOps Reporting Shift
The 2026 State of FinOps report indicates that 78% of FinOps teams now report to the CTO or CIO, signaling that cost management is now viewed as a technical architectural capability.
Insight Dissatisfaction
A 2026 survey of IT decision-makers by LogicMonitor found that 59% are dissatisfied with their platform’s ability to deliver actionable insights despite collecting massive data volumes.
AI Anomaly Detection
In the 2026 Grafana Labs Observability Survey, 92% of organizations identified AI-powered anomaly detection as the most valuable use case for preventing unexpected system downtime.
The shift toward open standards has completely rewritten the rules of cloud monitoring. With 95 percent of new projects standardizing on OpenTelemetry, the era of vendor-locked proprietary agents is officially over.
This universal adoption means engineering teams can now decouple their data collection strategy from their analytics backend. Organizations gain the freedom to route telemetry anywhere without rewriting their application code.
Financial accountability has become a core architectural requirement rather than a mere accounting afterthought. The recent State of FinOps report highlights that 78 percent of FinOps teams now report directly to technical leadership. This alignment signals that cloud cost management and telemetry ingestion are critical technical capabilities engineered from the ground up.
Despite spending millions on data storage, a staggering 59 percent of IT leaders remain frustrated by their platform’s inability to deliver actionable insights. Storing massive volumes of raw logs does not automatically translate to better system understanding. Teams are drowning in noise, highlighting an urgent need for intelligent edge filtering rather than passive ingestion.
The sheer volume of ephemeral events generated by modern architectures has pushed human analysis past its breaking point. Consequently, 92 percent of organizations now view AI-powered anomaly detection as their most critical defense against unexpected downtime. Intelligent algorithms are no longer a luxury, but a structural necessity to catch semantic drift before it cascades into total system failure.
Escaping the Trap of Fragmented Dashboards

Current industry data reveals that nearly half of all organizations run multiple observability tools in parallel, creating a chaotic operational environment. This tool sprawl actively prevents teams from establishing a single source of truth during high-stakes outages. On-call engineers are forced to manually reconstruct causality chains across fragmented logs, metrics, and traces.
This manual detective work extends downtime and burns out highly skilled site reliability engineers. Setup friction and alert configuration overhead have become greater hurdles than actual product feature limitations. OpenTelemetry-native unified observability solves this by centralizing context, ensuring that every trace and metric shares the same semantic foundation.
Leveraging Artificial Intelligence for Root Cause Analysis
Generative AI has rapidly moved from experimental prototypes to production-grade incident management. Leading observability platforms have introduced specialized AI agents that act as incident response experts alongside human engineers. These intelligent systems use shared telemetry context to automatically triage alerts and summarize complex root causes in plain language.
Human operators simply cannot manually correlate the millions of ephemeral events generated by serverless functions and microservices. AI integration is now a hard requirement to spot subtle semantic drift before it causes catastrophic system failure. By leveraging these smart features, teams can instantly translate technical anomalies into actionable business intelligence.
Reclaiming Budgets from Redundant Ingestion Models
Traditional ingestion-based pricing models are collapsing under their own weight as telemetry volume grows exponentially faster than infrastructure budgets. Companies frequently find that storing and analyzing monitoring data is more expensive than running the actual applications. Modern cloud observability strategies now focus heavily on technology value management rather than basic cost control.
New data optimization services allow organizations to filter out up to 90 percent of low-value telemetry at the network edge. A significant shift is the rise of collector customization, where advanced organizations build specialized pipelines to strip out redundant logs at the source. This strategic filtering effectively bypasses traditional vendor ingestion taxes while preserving high-fidelity data.
- Technology Value Management: Shifting the focus from raw cost cutting to maximizing the ROI of telemetry data.
- Edge Filtering: Dropping low-value logs before they ever hit the expensive analytics backend.
- Collector Customization: Building specialized pipelines to shape traffic dynamically based on system health.
Commoditizing Telemetry Through Open Standards

OpenTelemetry has achieved universal status, fundamentally altering the balance of power between software consumers and SaaS vendors. This massive shift has forced legacy providers to pivot away from proprietary collection agents toward open standards. Vendors are now competing entirely on backend query performance, AI capabilities, and cross-cloud governance.
Historically, proprietary lock-in made switching observability vendors a painful, multi-year migration project. Open standards have finally commoditized data collection, prioritizing true vendor interoperability and flexibility. Engineering teams can now swap out backend analytics platforms in days rather than months, ensuring they always have access to the best observability tools for cloud-native applications.
Shifting to Observability-as-Code for Better Adoption
Configuration complexity and dense enterprise dashboards remain the primary barriers to widespread observability adoption across development teams. Non-technical stakeholders and junior developers often find legacy interfaces completely inaccessible. This dynamic creates siloed knowledge where only a handful of senior engineers truly understand the system’s overall health.
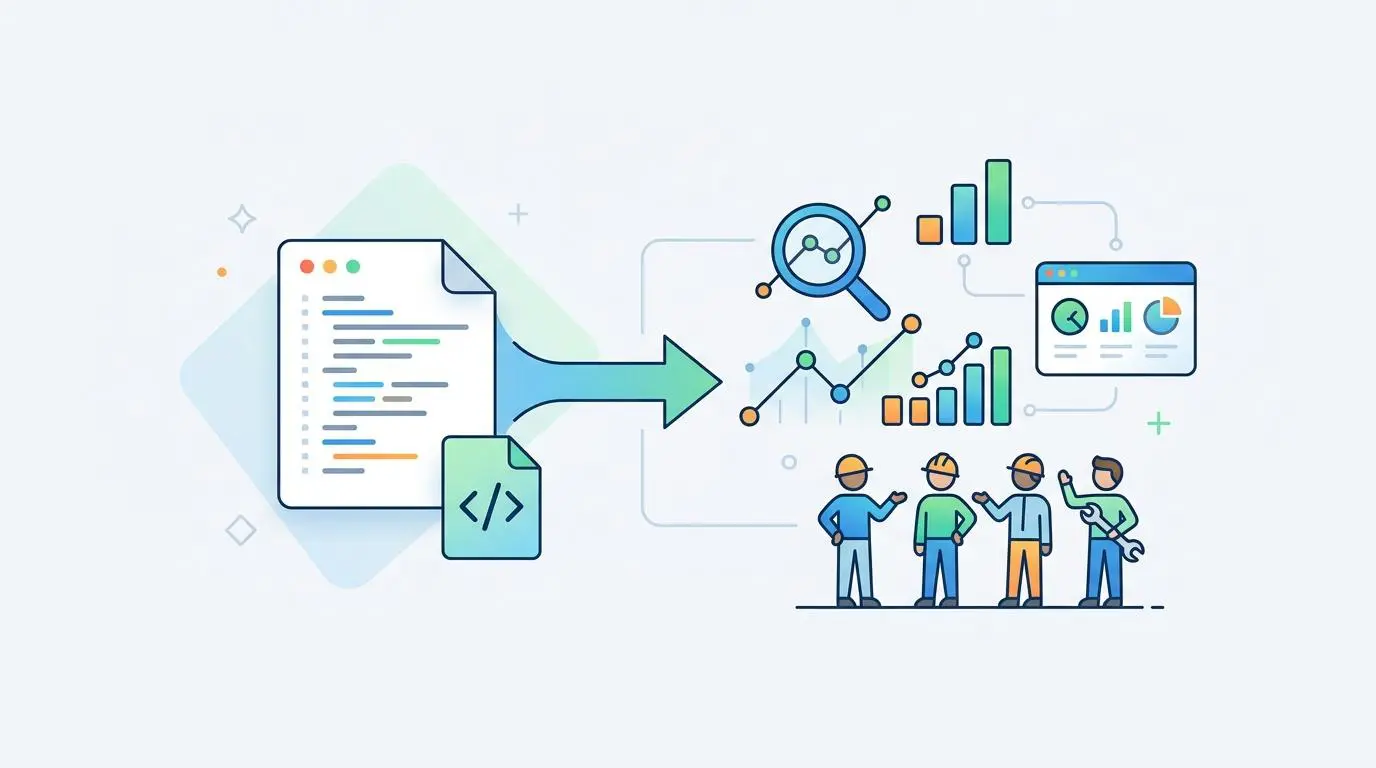
To break down these silos, the market is rapidly moving toward Observability-as-Code methodologies. This approach allows developers to define monitoring parameters, alerts, and dashboards directly within the application code itself. By treating observability configurations like standard software deployments, organizations ensure that monitoring remains consistent, version-controlled, and accessible to everyone.
Transitioning Toward Autonomous IT and Self-Healing Systems
The industry is actively transitioning toward autonomous IT, where observability platforms do much more than just send alerts to pagers. Modern platforms are beginning to trigger self-healing Kubernetes operators directly, bypassing the human element entirely. Organizations increasingly view autonomous AI action as the next logical step in incident management maturity.
The human investigation bottleneck is a structural flaw in modern cloud environments. In highly ephemeral microservices, the failure chain often begins and concludes before an engineer can even log into the terminal. Automated remediation ensures that systems can instantly optimize their own architecture, preventing minor anomalies from cascading into massive user-facing outages.
The Agentic Future of System Health
By late 2026, observability will fully evolve from a reactive monitoring category into an embedded agentic architecture. AI agents will act as the primary consumers of telemetry, performing real-time remediation and architectural self-optimization without any human intervention. This shift promises to finally eliminate the visibility gap and build truly resilient cloud-native ecosystems.
Navigating the intersection of modern technology, software architecture, and business growth requires a sharp strategy. To future-proof your tech stack and scale with precision, connect with Andres at Andres SEO Expert.
Frequently Asked Questions
What is the “Observability Tax” and how does it impact engineering velocity?
The Observability Tax refers to the hidden costs of manual log correlation across fragmented systems and exorbitant data ingestion fees. This operational friction creates a visibility gap that slows down engineering velocity and increases Mean Time To Resolution (MTTR) as teams struggle to find root causes in disconnected data.
Why has OpenTelemetry become the industry standard for cloud instrumentation?
OpenTelemetry has reached 95% adoption because it decouples data collection from the analytics backend. By ending vendor lock-in with proprietary agents, it allows engineering teams to route telemetry data to any platform without rewriting application code, ensuring long-term flexibility and interoperability.
How does AI-powered anomaly detection prevent system downtime?
With 92% of organizations prioritizing it, AI-powered anomaly detection uses intelligent algorithms to spot subtle semantic drift in ephemeral microservices that humans cannot manually track. These systems triage alerts in real-time and provide root cause summaries, allowing for intervention before a minor issue cascades into a total failure.
How can edge filtering reduce cloud observability costs?
Modern observability strategies utilize edge filtering to drop up to 90% of low-value, redundant telemetry data before it reaches expensive analytics backends. By using customized collectors and specialized pipelines, organizations can bypass traditional ingestion taxes while preserving high-fidelity data for critical analysis.
What are the benefits of an Observability-as-Code approach?
Observability-as-Code allows developers to define monitoring parameters, alerts, and dashboards directly within the application code itself. This eliminates the knowledge silos created by complex enterprise dashboards, making system health data accessible and ensuring version-controlled consistency across software deployments.
What is the role of Autonomous IT in modern incident management?
Autonomous IT transitions observability from reactive alerting to proactive remediation. By triggering self-healing Kubernetes operators and AI-driven adjustments, systems can resolve issues automatically, removing the human investigation bottleneck in highly ephemeral cloud-native environments.