


Executive Summary
- Server Timing Metrics provide a standardized mechanism for servers to pass performance data to the browser via HTTP headers, enabling granular visibility into backend processing times.
- These metrics are essential for identifying specific bottlenecks in the request-response cycle, such as database latency, cache lookups, and third-party API response times.
- By surfacing backend data to the frontend, developers can correlate server-side performance directly with Core Web Vitals, specifically Time to First Byte (TTFB) and Largest Contentful Paint (LCP).
What is Server Timing Metrics?
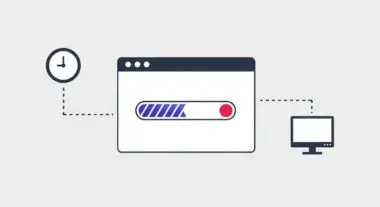
Server Timing Metrics refer to a W3C specification that enables a server to communicate performance-related information to the browser via HTTP response headers. Specifically, the Server-Timing header allows developers to pass custom metrics—such as database query duration, cache hit/miss status, or filesystem latency—directly to the client-side environment. This data is then accessible via the Navigation Timing API and the Resource Timing API, as well as within the “Timing” tab of browser developer tools.
Unlike traditional performance monitoring which often stops at the point the request reaches the server, Server Timing provides a transparent bridge between backend execution and frontend perception. By quantifying the time spent in different stages of the server-side request lifecycle, performance architects can distinguish between network latency and application-level processing delays. This granularity is vital for debugging complex microservices architectures and distributed systems where a single request may traverse multiple internal layers.
The Real-World Analogy
Imagine ordering a custom-built piece of furniture. Without Server Timing, you only know the date you ordered it and the date it arrived at your door. If it took six months, you have no way of knowing if the delay was caused by a shortage of raw materials, a slow craftsman, or a bottleneck in the shipping department. Server Timing is equivalent to receiving a detailed log with your delivery that specifies: 10 days for wood sourcing, 40 days for assembly, and 5 days for finishing. This breakdown allows you to identify exactly which part of the production chain needs optimization to speed up future orders.
Why is Server Timing Metrics Critical for Website Performance and Speed Engineering?
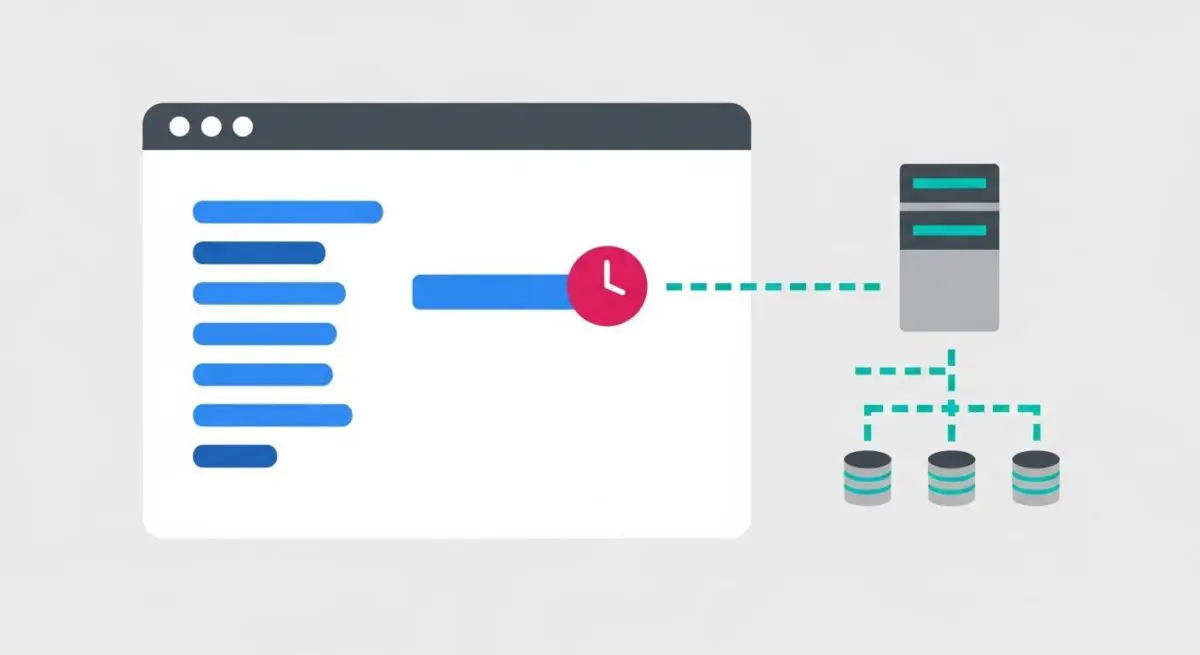
In the context of modern speed engineering, Server Timing is the primary diagnostic tool for optimizing Time to First Byte (TTFB). While TTFB measures the total duration from the initial request to the first byte of the response, it is often a “black box” metric. Server Timing decomposes this metric, revealing whether a high TTFB is due to slow database execution, inefficient template rendering, or cold-start latencies in serverless functions. By optimizing these specific backend segments, engineers can directly improve Largest Contentful Paint (LCP), as a faster server response accelerates the entire critical rendering path.
Best Practices & Implementation
- Implement Granular Tracking: Break down the server-side lifecycle into logical segments such as “db” (database), “cache” (CDN/Redis), and “auth” (authentication) to pinpoint the exact source of latency.
- Use Millisecond Precision: Always report durations in milliseconds (e.g., Server-Timing: db;dur=52.3) to ensure the data is actionable for high-performance tuning.
- Leverage Edge Computing: Use Server Timing at the Edge (CDN level) to report on cache performance and origin shield latency, providing visibility into the global distribution network’s efficiency.
- Integrate with RUM: Programmatically collect Server-Timing data using the PerformanceObserver API and send it to your Real User Monitoring (RUM) provider to correlate backend performance with actual user experience.
Common Mistakes to Avoid
One frequent error is exposing sensitive infrastructure details or internal IP addresses within the header descriptions, which can present a security risk; always use abstracted labels. Another mistake is failing to account for the overhead of the headers themselves; while the impact is usually negligible, excessive or overly verbose metrics can unnecessarily increase the size of the HTTP response headers, potentially impacting performance on high-latency connections.
Conclusion
Server Timing Metrics are indispensable for modern performance observability, transforming the backend request lifecycle from a hidden process into a transparent, measurable sequence. By surfacing these metrics, organizations can achieve a holistic view of the delivery pipeline and execute data-driven optimizations to minimize latency.