


Executive Summary
- Pingdom provides synthetic monitoring and Real User Monitoring (RUM) to track website uptime and performance metrics.
- The platform generates granular waterfall charts to identify bottlenecks in DNS resolution, SSL handshakes, and Time to First Byte (TTFB).
- It is a critical tool for maintaining Core Web Vitals by identifying render-blocking resources and unoptimized assets across global test locations.
What is Pingdom?
Pingdom is a sophisticated synthetic monitoring and performance analysis platform owned by SolarWinds. It is designed to provide web performance architects and DevOps engineers with high-frequency data regarding website availability and end-user experience. By utilizing a global network of probe servers, Pingdom simulates user requests to measure uptime, response times, and the overall health of web infrastructure. It serves as a diagnostic layer that bridges the gap between server-side logs and client-side performance.
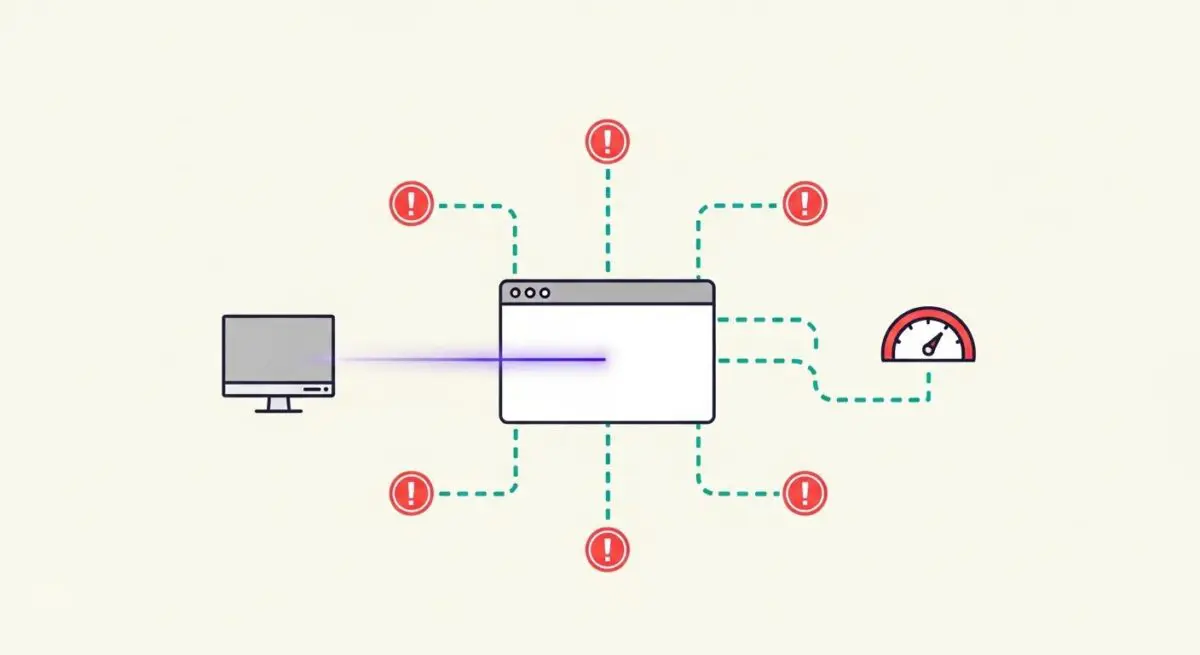
The platform’s primary technical value lies in its Page Speed Test, which deconstructs the loading process of a web page into a detailed waterfall visualization. This allows engineers to analyze individual HTTP requests, identifying specific assets—such as JavaScript bundles, CSS files, or high-resolution images—that contribute to latency. Beyond synthetic testing, Pingdom offers Real User Monitoring (RUM), which collects performance data from actual visitors to provide a comprehensive view of how a site performs across different browsers, devices, and network conditions.
The Real-World Analogy
Think of Pingdom as a global network of automated security guards and timekeepers stationed at every entrance of a massive international shopping mall. These guards don’t just check if the doors are unlocked (uptime); they use stopwatches to measure exactly how long it takes for a customer to walk through the door, find the information desk, and receive their first service. If a specific entrance in London is jammed or a hallway in Tokyo is cluttered with boxes, these guards immediately report the exact location and cause of the delay to the central management office, allowing them to clear the path before it affects the shoppers’ experience.
Why is Pingdom Critical for Website Performance and Speed Engineering?
Pingdom is essential for the rigorous optimization of Core Web Vitals (CWV), particularly Largest Contentful Paint (LCP) and First Input Delay (FID). By providing a breakdown of the Time to First Byte (TTFB), Pingdom helps engineers determine if performance issues are rooted in server-side processing, database queries, or inefficient Content Delivery Network (CDN) configurations. Its ability to track SSL/TLS handshake durations and DNS lookup times is vital for identifying network-level inefficiencies that often go unnoticed in standard development environments.
Furthermore, Pingdom’s automated alerting system acts as a fail-safe for enterprise hosting. In the event of a performance regression or a total outage, the platform provides immediate notification, often including the specific error code (e.g., 503 Service Unavailable or 404 Not Found). This rapid feedback loop is critical for maintaining high availability and ensuring that frontend optimizations are not negated by backend instability or third-party script failures.
Best Practices & Implementation
- Leverage Geographic Testing: Always configure tests from locations that mirror your primary user base to account for regional latency and CDN edge-server performance.
- Monitor the Waterfall: Regularly audit the request waterfall to identify render-blocking resources and implement defer or async attributes on non-critical scripts.
- Establish Performance Budgets: Use Pingdom’s reporting to set strict limits on total page weight and the number of HTTP requests, triggering alerts when these thresholds are exceeded.
- Integrate Transaction Monitoring: Beyond simple page loads, monitor critical user paths—such as login sequences or checkout flows—to ensure functional integrity under varying loads.
- Correlate Synthetic and RUM Data: Use synthetic tests for baseline benchmarking and RUM data to understand the impact of real-world variables like mobile CPU throttling and intermittent connectivity.
Common Mistakes to Avoid
One frequent error is relying exclusively on a single test location, which can mask routing issues or localized outages affecting a significant portion of the audience. Another mistake is ignoring the impact of third-party scripts; many brands fail to realize that a slow-loading tracking pixel or chat widget can significantly delay the window.onload event. Finally, many teams treat Pingdom as a reactive tool rather than a proactive one, failing to integrate its data into their continuous integration/continuous deployment (CI/CD) pipelines to catch performance regressions before they reach production.
Conclusion
Pingdom is a foundational pillar of modern performance engineering, providing the visibility required to optimize complex web architectures. By combining synthetic uptime monitoring with deep-dive waterfall analysis, it enables brands to maintain the speed and reliability necessary for superior SEO and user retention.