


Executive Summary
- Provides full-stack observability through telemetry data including metrics, events, logs, and traces (MELT).
- Enables precise identification of server-side bottlenecks, database latency, and unoptimized code paths.
- Facilitates Real User Monitoring (RUM) to track and improve Core Web Vitals based on actual field data.
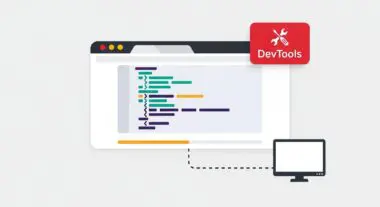
What is New Relic?
New Relic is a sophisticated cloud-based observability platform designed to provide comprehensive insights into the performance of software applications and underlying infrastructure. It operates primarily as an Application Performance Monitoring (APM) solution, utilizing agents to collect telemetry data—specifically metrics, events, logs, and traces. This data allows engineers to visualize the entire stack, from the frontend user experience to backend database transactions, ensuring that performance degradation is identified and remediated before impacting the end-user.
By instrumenting application code at the runtime level, New Relic captures granular execution details, such as transaction traces and error rates. This level of visibility is critical for modern, distributed architectures where a single user request may traverse multiple microservices. New Relic aggregates this complex data into actionable dashboards, allowing performance architects to maintain high availability and optimal throughput in high-traffic enterprise environments.
The Real-World Analogy
Imagine a high-performance race car equipped with hundreds of internal sensors monitoring everything from fuel combustion temperature to tire pressure in real-time. Without these sensors, a mechanic only knows the car is slow after the race is over. With New Relic, the mechanic (developer) can see exactly which cylinder is misfiring or where the friction is occurring while the car is still on the track, allowing for immediate, data-driven adjustments to ensure the vehicle maintains peak velocity.
Why is New Relic Critical for Website Performance and Speed Engineering?
New Relic is a cornerstone of speed engineering because it provides the empirical data necessary to optimize Core Web Vitals and server response times. It allows developers to diagnose high Time to First Byte (TTFB) by pinpointing slow SQL queries, inefficient third-party APIs, or memory leaks within the application layer. By reducing server-side processing time, New Relic directly contributes to a faster Largest Contentful Paint (LCP).
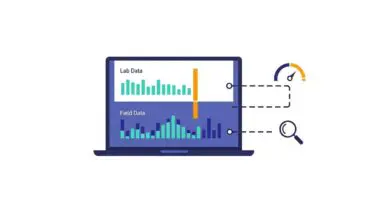
Furthermore, its Browser monitoring capabilities offer Real User Monitoring (RUM), which captures performance data from actual browsers in the field. Unlike synthetic lab tests, this data reflects the impact of real-world variables such as network latency and device processing power on Interaction to Next Paint (INP) and Cumulative Layout Shift (CLS), providing a more accurate roadmap for performance optimization.
Best Practices & Implementation
- Enable Distributed Tracing: Use distributed tracing to track requests across microservices to identify which specific service is introducing latency in the request chain.
- Monitor Database Performance: Regularly review the Slowest Transactions and Database reports to identify and refactor N+1 query problems or missing indexes.
- Integrate with CI/CD: Use deployment markers to correlate new code releases with changes in performance metrics, allowing for immediate rollbacks if latency increases.
- Set Up Proactive Alerting: Configure alerts based on Apdex scores and error rate thresholds to notify engineering teams before performance issues breach Service Level Agreements (SLAs).
Common Mistakes to Avoid
A frequent error is over-instrumenting non-critical components, which can introduce observer overhead, slightly slowing down the very application being monitored. Another mistake is relying solely on aggregate data while ignoring outliers; performance tails (the 99th percentile) often hide the most significant UX issues that New Relic is designed to uncover.
Conclusion
New Relic transforms website performance from a reactive task into a proactive engineering discipline, providing the deep observability required to maintain elite speed standards.