


Executive Summary
- Provides granular visibility into the network lifecycle of individual sub-resources via the PerformanceResourceTiming interface.
- Critical for identifying high-latency phases such as DNS resolution, TCP handshakes, and TLS negotiation for specific assets.
- Enables precise optimization of third-party scripts and CDN delivery by exposing transfer sizes and encoded body lengths.
What is Resource Timing Metrics?
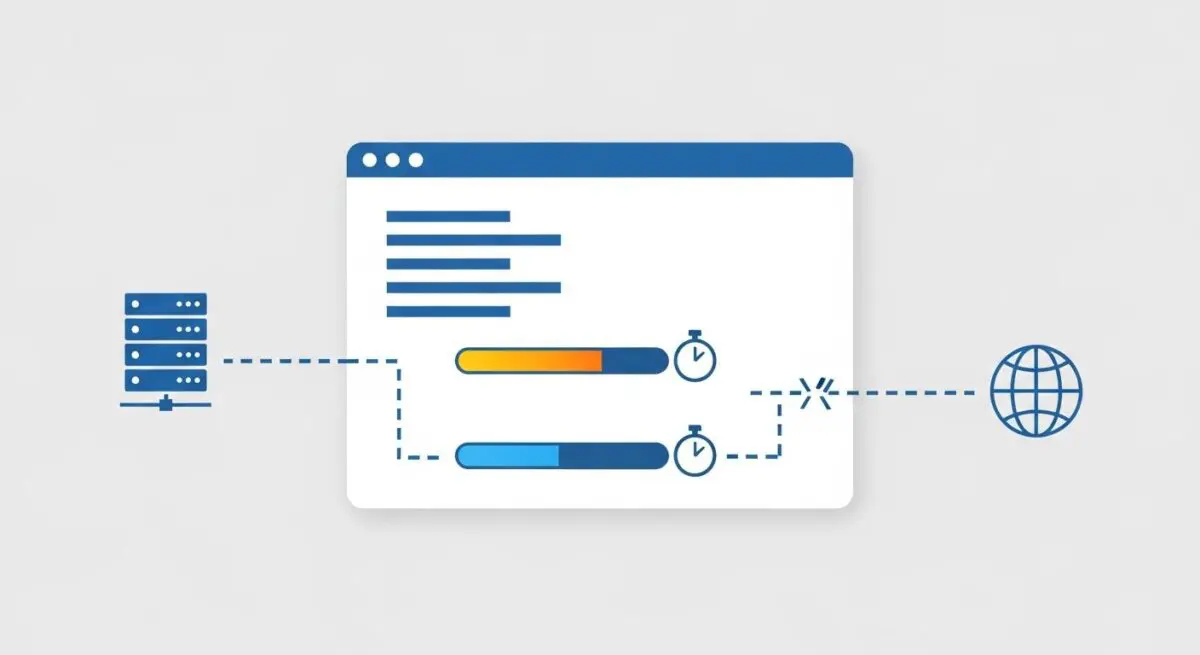
Resource Timing Metrics are a subset of the W3C Web Performance API that provide high-resolution timestamps for the loading of a document’s sub-resources, such as images, scripts, stylesheets, and XMLHttpRequest/Fetch calls. These metrics are accessed via the PerformanceResourceTiming interface, which extends the PerformanceEntry object. By capturing specific timestamps throughout the network lifecycle, developers can measure the exact duration of phases including redirection, DNS lookup, TCP connection, TLS negotiation, and the actual data transfer.
Unlike high-level page load metrics, Resource Timing allows for a granular audit of the waterfall for every individual asset. This data includes properties like fetchStart, requestStart, responseStart, and responseEnd. It also provides critical metadata regarding the resource’s size, such as transferSize, encodedBodySize, and decodedBodySize, which are essential for verifying the efficiency of compression algorithms and cache hits at the edge.
The Real-World Analogy
Imagine ordering a custom piece of furniture from an international supplier. If you only know the order date and the delivery date, you cannot identify why it took six weeks to arrive. Resource Timing Metrics act like a detailed logistics log: it records exactly when the order was processed, how long it sat in customs, the duration of the trans-Atlantic flight, and the time spent on the local delivery truck. If the delivery is slow, this log reveals whether the bottleneck was the manufacturer’s production speed (Server Response Time) or a delay at the shipping port (DNS/TCP latency).
Why is Resource Timing Metrics Critical for Website Performance and Speed Engineering?
In the era of Core Web Vitals, Resource Timing Metrics are indispensable for diagnosing Largest Contentful Paint (LCP) issues. If the LCP element is an image, these metrics reveal if the delay is due to slow Time to First Byte (TTFB) or a congested network path. Furthermore, they allow engineers to identify “long tasks” caused by slow-loading scripts that contribute to Total Blocking Time (TBT). By analyzing the gap between secureConnectionStart and connectEnd, performance architects can quantify the overhead of TLS handshakes and decide if moving to a more efficient protocol like HTTP/3 or optimizing OCSP stapling is necessary.
Best Practices & Implementation
- Enable Timing-Allow-Origin: Ensure that the Timing-Allow-Origin HTTP header is configured on CDNs and third-party servers to allow the browser to access detailed timing data that would otherwise be restricted due to cross-origin security policies.
- Monitor Transfer Efficiency: Compare encodedBodySize against decodedBodySize to ensure that resources are being properly compressed (e.g., via Brotli or Gzip) before transmission.
- Analyze Connection Reuse: Use the nextHopProtocol property to verify that assets are being delivered over modern protocols like HTTP/2 or HTTP/3, which support multiplexing and reduce head-of-line blocking.
- Automate RUM Collection: Implement Real User Monitoring (RUM) scripts that use performance.getEntriesByType(‘resource’) to aggregate network performance data from actual users across different geographic locations and network conditions.
Common Mistakes to Avoid
The most frequent error is neglecting the Timing-Allow-Origin header on cross-origin assets; without this, many timing properties return zero, rendering the metrics useless for third-party scripts. Another mistake is failing to account for the impact of service workers, which can alter timing data by intercepting requests and serving them from a local cache, potentially skewing network latency reports if not correctly filtered.
Conclusion
Resource Timing Metrics provide the granular telemetry required to transform high-level performance observations into actionable engineering optimizations for modern, asset-heavy web applications.