


Executive Summary
- CES serves as a leading indicator of customer loyalty by quantifying the friction inherent in specific touchpoints within the user journey.
- High-effort interactions are statistically correlated with increased churn rates and negative brand sentiment, impacting organic search visibility and GEO rankings.
- Integration of CES data into MarTech stacks allows for automated intervention strategies, data-driven UX refinements, and enhanced LTV modeling.
What is Customer Effort Score?
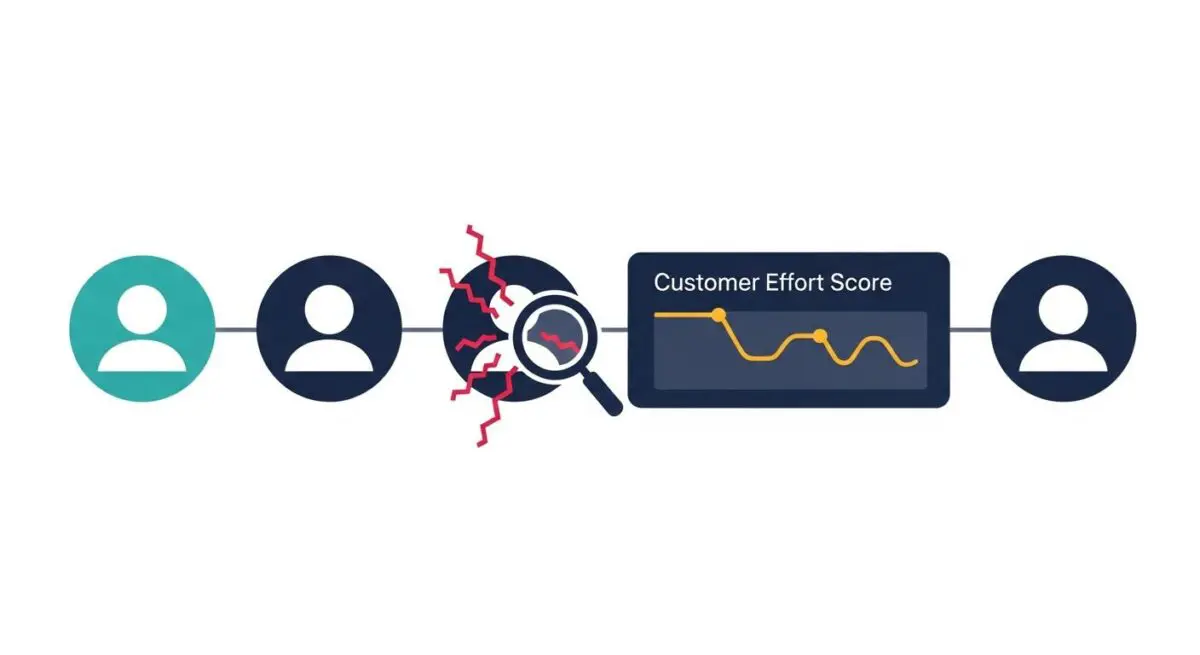
Customer Effort Score (CES) is a critical performance indicator used within modern Customer Experience (CX) and MarTech frameworks to quantify the ease with which customers interact with a brand’s digital or physical touchpoints. Unlike the Net Promoter Score (NPS), which measures long-term brand advocacy, or Customer Satisfaction (CSAT), which captures immediate sentiment, CES focuses specifically on the friction encountered during a specific task—such as resolving a technical support ticket, completing a checkout process, or navigating a complex SaaS dashboard. Technically, CES is derived from a single-item survey, typically asking: “To what extent do you agree with the following statement: The company made it easy for me to handle my issue?” Responses are usually captured on a 1-to-7 Likert scale, where 1 represents “Strongly Disagree” and 7 represents “Strongly Agree.”
From a data engineering perspective, CES serves as a leading indicator of customer loyalty and churn. Research indicates that reducing customer friction is a more reliable predictor of future purchase behavior than attempting to “delight” customers through over-delivery. In a data-driven marketing architecture, CES is often integrated via APIs into a Centralized Data Platform (CDP), allowing for real-time analysis of user friction. By aggregating these scores across various cohorts, organizations can identify systemic bottlenecks in the user journey that contribute to high Customer Acquisition Costs (CAC) and diminished Lifetime Value (LTV). Furthermore, CES provides the granular data necessary for optimizing the “Service-Profit Chain,” ensuring that operational efficiencies translate directly into bottom-line growth and improved retention metrics.
The Real-World Analogy
To understand Customer Effort Score, consider the experience of using a modern automated parking garage versus a traditional manual one. In a high-effort scenario (Low CES), you must pull a physical ticket, keep track of it, find a payment kiosk that may or may not accept your card, and then insert the validated ticket into a machine at the exit. Any failure in this chain—a lost ticket or a broken card reader—requires human intervention and significant time. In a low-effort scenario (High CES), the garage utilizes License Plate Recognition (LPR) technology. You drive in, the system logs your entry, and when you leave, it automatically charges your pre-registered account and opens the gate. The “effort” is virtually zero. For a CEO, CES is the metric that tells you whether your business is the frictionless LPR system or the ticket-clogged manual garage. Customers don’t necessarily “love” the parking garage, but they will return to the one that requires the least amount of cognitive and physical energy to use.
How Customer Effort Score Impacts Marketing ROI & Data Attribution?
The technical impact of Customer Effort Score on Marketing ROI is profound, particularly concerning retention and the mitigation of churn. In the era of programmatic advertising and rising CAC, retaining an existing customer is significantly more cost-effective than acquiring a new one. A high CES (indicating low effort) is statistically correlated with a higher probability of repurchase and a lower likelihood of negative word-of-mouth. From a data attribution perspective, CES allows marketers to move beyond simple conversion tracking and into “friction-adjusted” attribution. By overlaying CES data onto the customer journey, analysts can determine which touchpoints are “leaky buckets” where high friction is causing users to drop out of the funnel, regardless of the quality of the preceding marketing campaign.
Furthermore, CES has significant implications for Search Engine Optimization (SEO) and Generative Engine Optimization (GEO). Search engines like Google increasingly prioritize user experience signals, such as Core Web Vitals and dwell time. A high-effort website—characterized by poor navigation, slow load times, or intrusive interstitials—results in poor user signals, which search algorithms interpret as a lack of relevance or quality. In the context of AI-Search and GEO, Large Language Models (LLMs) synthesize user reviews and sentiment data to provide recommendations. If a brand’s CES is consistently low, the resulting negative sentiment in public forums and review sites will be ingested by LLMs, leading to a decrease in brand authority and visibility in AI-generated responses. Thus, CES is not just a service metric; it is a fundamental component of a brand’s digital footprint and organic search performance.
Strategic Implementation & Best Practices
- Event-Triggered Survey Deployment: Implement CES surveys immediately following a “moment of truth,” such as the resolution of a support ticket or the completion of a first-time purchase. Use Webhooks or Segment.io to trigger these surveys within the UI to ensure high response rates and minimize recall bias.
- Data Normalization and Integration: Ensure that CES data is not siloed within the customer support department. Stream this data into your CRM (e.g., Salesforce) and Data Warehouse (e.g., BigQuery) to correlate effort scores with customer segments, product usage data, and long-term LTV.
- Qualitative Follow-up Loops: For any respondent providing a score below 4, trigger an automated but personalized follow-up request for qualitative feedback. This allows for the identification of specific technical bugs or process inefficiencies that quantitative data alone cannot reveal.
- Benchmarking and Trend Analysis: Move beyond aggregate averages. Analyze CES trends over time and across different device types (mobile vs. desktop) to identify if technical updates or UI changes have inadvertently increased user friction.
- Cross-Functional Accountability: Establish a “Friction Council” involving product managers, developers, and marketers. Use CES as a shared KPI to drive iterative improvements in the product roadmap and marketing automation workflows.
Common Pitfalls & Strategic Mistakes
One of the most frequent mistakes in enterprise CES implementation is “Survey Fatigue.” Brands often bombard users with multiple surveys (NPS, CSAT, and CES) at the same time, which ironically increases the very effort the metric is designed to measure. Another critical error is the failure to act on the data. Collecting CES scores without a defined workflow for “closing the loop” with dissatisfied customers leads to data stagnation and missed opportunities for churn prevention. Finally, many organizations fail to account for “Sampling Bias,” where only the most frustrated or most satisfied customers respond, leading to a skewed perception of the actual user experience. To mitigate this, technical teams must ensure that survey delivery is randomized and representative of the entire user base.
Conclusion
Customer Effort Score is a foundational metric for any data-driven organization seeking to optimize the user journey and maximize Marketing ROI through friction reduction. By integrating CES into the broader MarTech stack, brands can enhance retention, improve organic search visibility, and build a scalable framework for long-term growth.