

Executive Summary
- Aggregates synthetic Lighthouse lab data and real-world Chrome User Experience Report (CrUX) field data.
- Serves as the primary diagnostic interface for measuring Core Web Vitals, which are critical SEO ranking signals.
- Identifies specific bottlenecks in the Critical Rendering Path, including render-blocking resources and main-thread execution delays.
What is Google PageSpeed Insights?
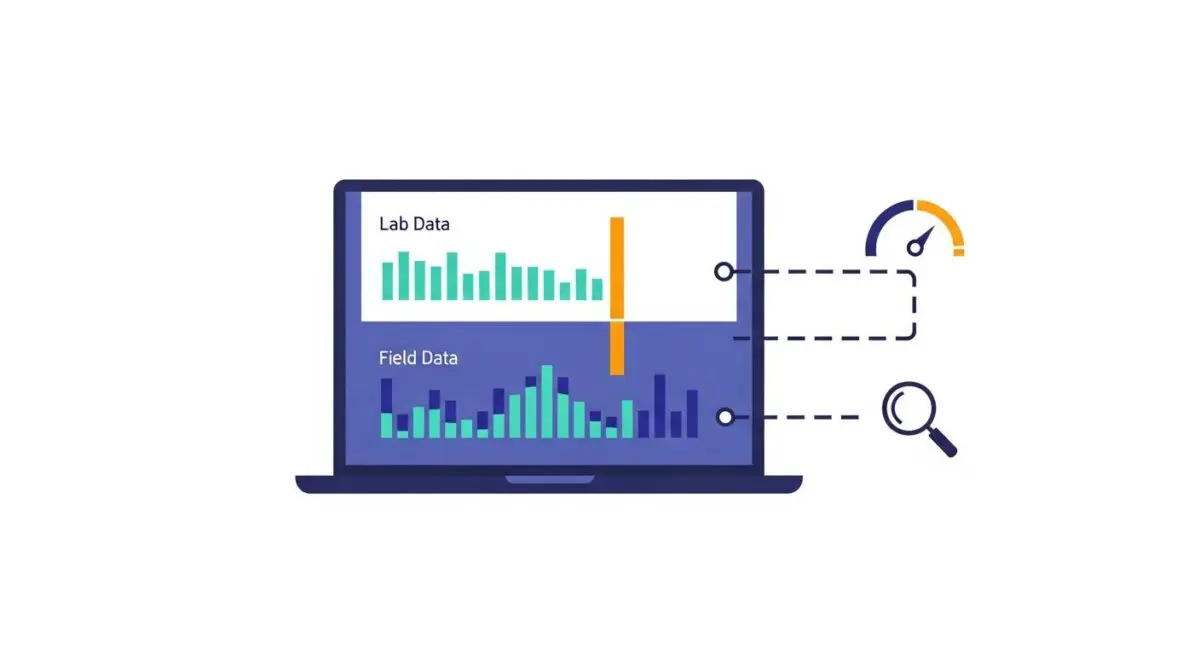
Google PageSpeed Insights (PSI) is a sophisticated performance diagnostic tool that provides a comprehensive analysis of a web page’s user experience on both mobile and desktop environments. It functions by executing a dual-layered data collection process: synthetic “Lab Data” generated via the Lighthouse engine in a controlled environment, and “Field Data” sourced from the Chrome User Experience Report (CrUX). This combination allows developers to visualize how a page performs under standardized conditions versus how it behaves for actual users across varying network speeds and device capabilities.
Technically, PSI evaluates a URL against a set of performance audits, providing a weighted score from 0 to 100. However, the tool’s primary value lies in its granular reporting on Core Web Vitals (CWV), such as Largest Contentful Paint (LCP), Interaction to Next Paint (INP), and Cumulative Layout Shift (CLS). By analyzing these metrics, engineers can pinpoint whether performance issues originate from server-side latency, inefficient client-side scripting, or unoptimized asset delivery.
The Real-World Analogy
Think of Google PageSpeed Insights as a comprehensive vehicle diagnostic report provided by a professional racing team. The “Lab Data” is equivalent to a car’s performance on a high-tech treadmill in a climate-controlled garage; it tells you the theoretical maximum speed and efficiency under perfect conditions. The “Field Data” is like the telemetry data collected from thousands of actual drivers using that same car model on real city streets, highways, and dirt roads. While the garage test shows what the car can do, the telemetry shows how it actually performs in the hands of real people facing real-world obstacles.
Why is Google PageSpeed Insights Critical for Website Performance and Speed Engineering?
Google PageSpeed Insights is critical because it bridges the gap between raw technical metrics and search engine visibility. Since the introduction of the Page Experience Update, Core Web Vitals have become direct ranking factors within Google’s search algorithm. PSI provides the specific diagnostic data required to optimize the Critical Rendering Path, allowing engineers to identify and eliminate render-blocking JavaScript and CSS that delay the first meaningful paint.
Furthermore, PSI offers insights into server response times (Time to First Byte) and resource prioritization. By highlighting issues like excessive DOM size or unoptimized image payloads, it enables performance architects to implement precise speed engineering strategies. This directly impacts user retention; as page load times increase from one second to three seconds, the probability of a bounce increases by 32%, making PSI an essential tool for maintaining conversion rates and organic search health.
Best Practices & Implementation
- Optimize the Critical Rendering Path: Identify and inline critical CSS required for above-the-fold content while using async or defer attributes for non-essential JavaScript to prevent main-thread blocking.
- Implement Advanced Image Compression: Utilize modern formats such as WebP or AVIF and employ responsive image techniques with srcset and sizes attributes to ensure the browser only downloads the necessary resolution for the user’s viewport.
- Prioritize Resource Loading: Use rel=”preload” for critical assets like fonts or hero images and rel=”preconnect” for essential third-party origins to reduce DNS lookup and connection latency.
- Minimize Layout Shifts: Assign explicit width and height attributes to all media elements and reserve space for dynamic content (like ads) to ensure a stable Cumulative Layout Shift (CLS) score.
Common Mistakes to Avoid
A frequent error is chasing a perfect 100/100 Lab score while ignoring the Field Data (CrUX) trends, which represent the actual user experience. Another mistake is failing to account for the impact of third-party scripts, such as tag managers or analytics, which often contribute significantly to Total Blocking Time (TBT) but are overlooked during initial development. Finally, many brands optimize only for desktop performance, neglecting the mobile-first indexing reality where CPU throttling and slower mobile networks significantly degrade performance scores.
Conclusion
Google PageSpeed Insights is an indispensable diagnostic framework for modern web performance, providing the technical roadmap necessary to align site architecture with Core Web Vitals standards. Mastery of its data outputs is essential for any enterprise seeking to optimize for both search engine visibility and user retention.