

Key Points
- Visual Uniqueness Thresholds: Automate Bannerbear V5 with Airtable to bypass the visual fingerprint bottleneck enforced by the June 2026 Core Update.
- Edge-Side Optimization: Prevent the programmatic crawl budget trap by dynamically converting high-resolution assets to WebP/AVIF at the Edge.
- Asynchronous Indexation: Implement robust queuing systems for IndexNow to avoid 429 errors when batch-processing thousands of generated infographics.
Table of Contents
The Visual Uniqueness Mandate
The harsh truth about scaling programmatic SEO in 2026 is that pixel-perfect text is no longer enough to survive algorithmic scrutiny. Historically, massive programmatic builds relied heavily on duplicate or slightly altered stock imagery to populate thousands of landing pages. This architectural shortcut created a severe vulnerability.
The June 2026 Google Core Update aggressively penalized these sites by enforcing strict visual uniqueness thresholds. When search engine bots detect a repetitive visual fingerprint across high-volume media assets, they systematically devalue the entire programmatic directory. This bottleneck caused massive traffic drops for sites failing to differentiate their media.
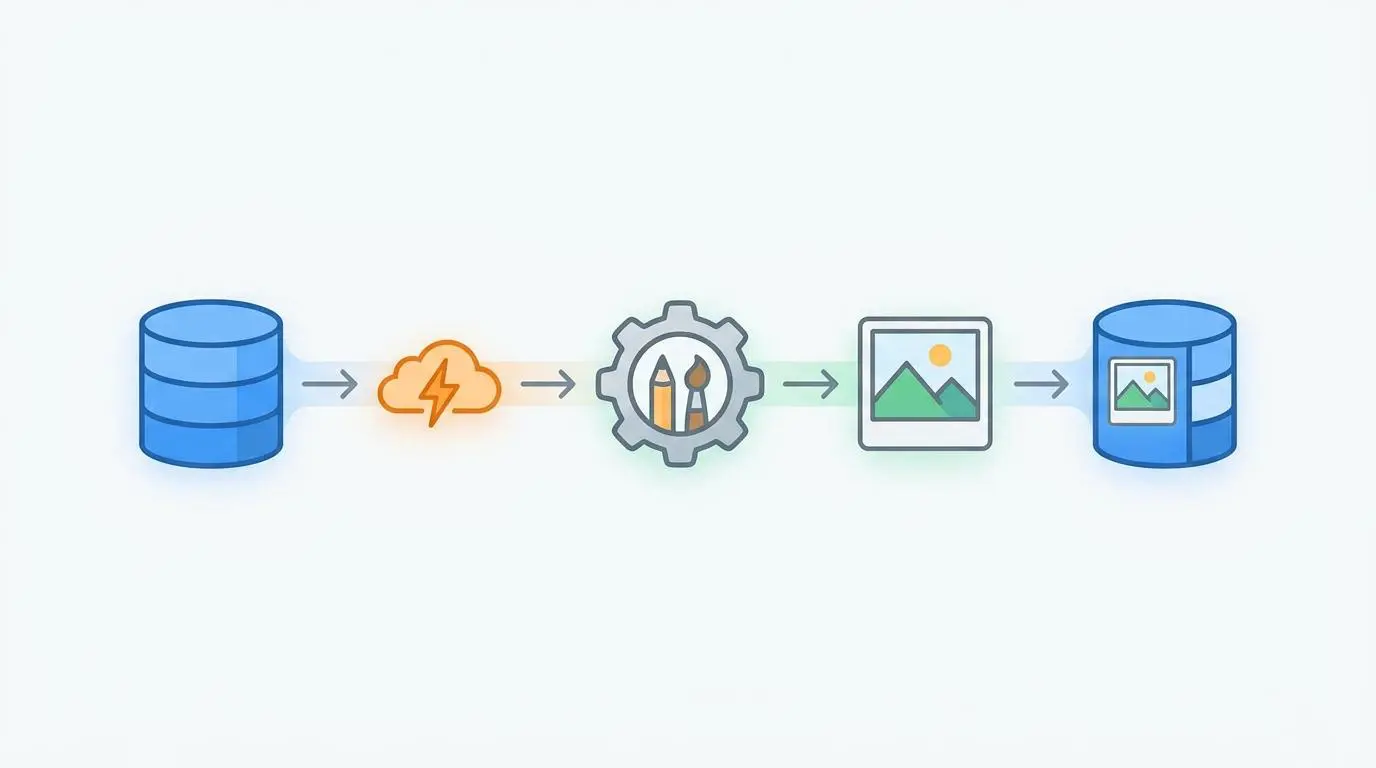
Programmatic visual content generation is the definitive solution to this architectural crisis. By dynamically rendering custom, data-rich infographics based on relational databases, engineers guarantee that every generated landing page features a statistically unique visual asset. This approach satisfies visual uniqueness thresholds and transforms static pages into high-value data hubs.
Quantifying Multimodal Engagement
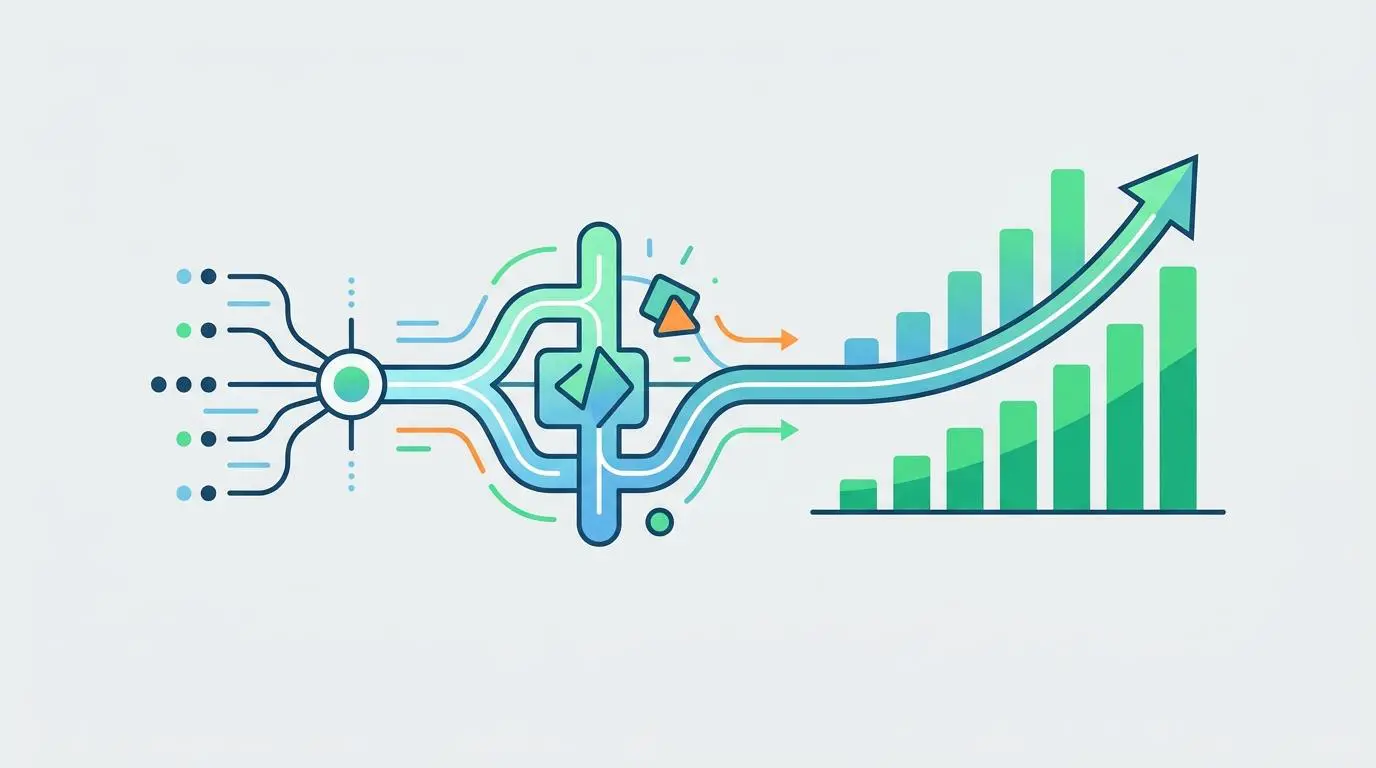
Properly formatted, data-dense infographics are now cited as a primary driver for appearing in Google’s multimodal AI Overviews. Industry reports indicate that sites implementing these automated visual pipelines experienced a significant organic traffic lift by mid-2026. This traffic surge is directly tied to the algorithm’s preference for rich, structured media that answers complex queries at a glance.
Furthermore, retailers and data-driven platforms utilizing unique visual search-friendly assets saw a 16% rise in customer engagement. To ensure these generated assets are properly understood by search engines, modern workflows utilize advanced OCR text extraction tools as a mandatory pre-index check. This guarantees that the text embedded within the infographic is fully machine-readable and semantically aligned with the page content.
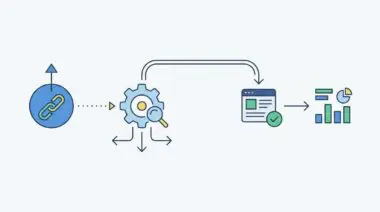
Generating these assets is only half the battle. Delivering them to search engine crawlers without latency requires a highly orchestrated infrastructure. Engineers increasingly rely on IndexNow API integration for rapid crawling to ensure heavy media files are discovered and indexed within minutes. This tight feedback loop between creation and indexation separates successful programmatic campaigns from stagnant ones.
Architecting Adaptive Visual Pipelines
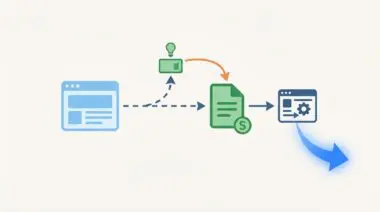
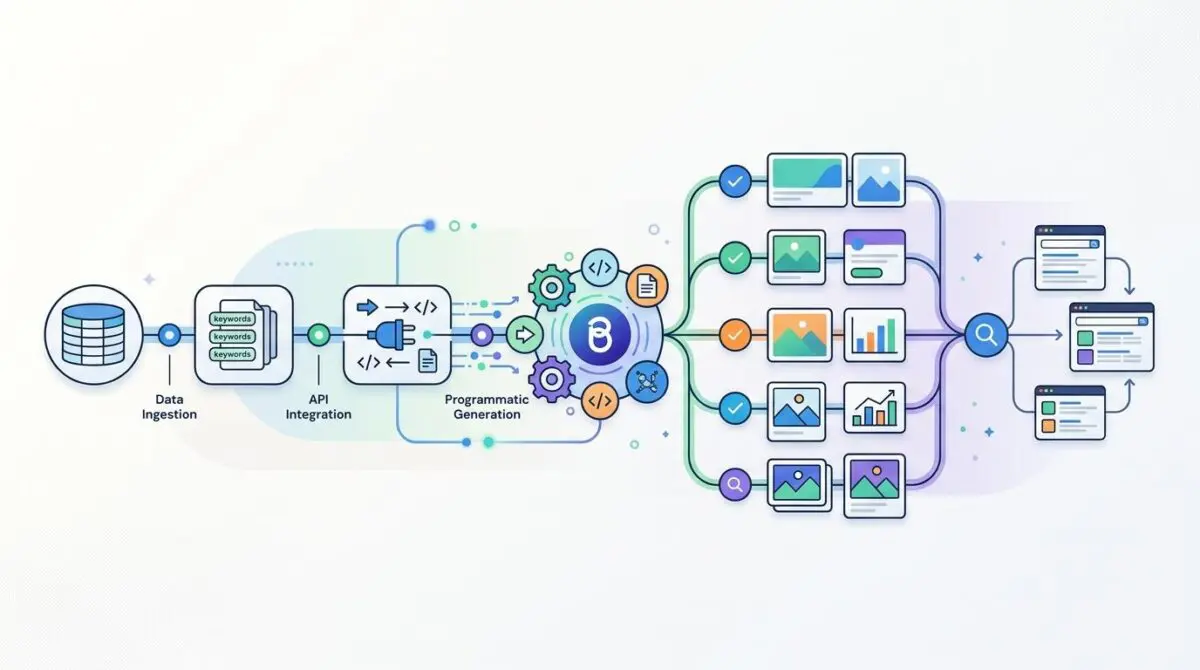
The release of Bannerbear V5 revolutionized how we approach dynamic image creation. The introduction of adaptive resizing endpoints allows for true 1:1 image-to-data mapping. When coupled with Airtable’s native webhooks and AI build-prompts, the system generates a visualization that is statistically unique in both its pixel-hash and underlying metadata.
A single Airtable record containing raw data can automatically trigger a bespoke infographic generation without any manual intervention. The AI interprets the data context, adjusts the layout dynamically, and outputs a perfectly scaled asset. This guarantees that no two landing pages share the same visual fingerprint.
Despite these advancements, real-world friction persists within the synchronization layer. Maintaining a flawless sync between relational databases and credit-based generation logs is notoriously difficult. This often results in orphaned records where the HTML page exists, but the dynamic image fails to render due to hidden generation costs.
Validating Media at Edge Scale

Vision AI has become a standard pre-index check for any serious programmatic architecture. Modern pipelines automatically verify that generated infographics meet strict contrast standards before they are committed to the CDN. This ensures accessibility compliance while maximizing optical character recognition readability for search bots.
The primary danger in scaling this workflow is the programmatic crawl budget trap. When thousands of high-resolution generated assets are pushed live simultaneously, they easily overwhelm bot capacity. If a search engine crawler spends too much time downloading heavy infographics, it abandons the crawl and leaves crucial pages unindexed.
To solve this, dynamic WebP and AVIF conversion must occur at the Edge. Without this serverless optimization, massive media assets increase the time to first byte well beyond modern Core Web Vitals thresholds. Offloading image compression to Edge nodes ensures bots receive lightweight payloads instantly, preserving crawl budget for deeper site exploration.
Structuring Data for AI Overviews
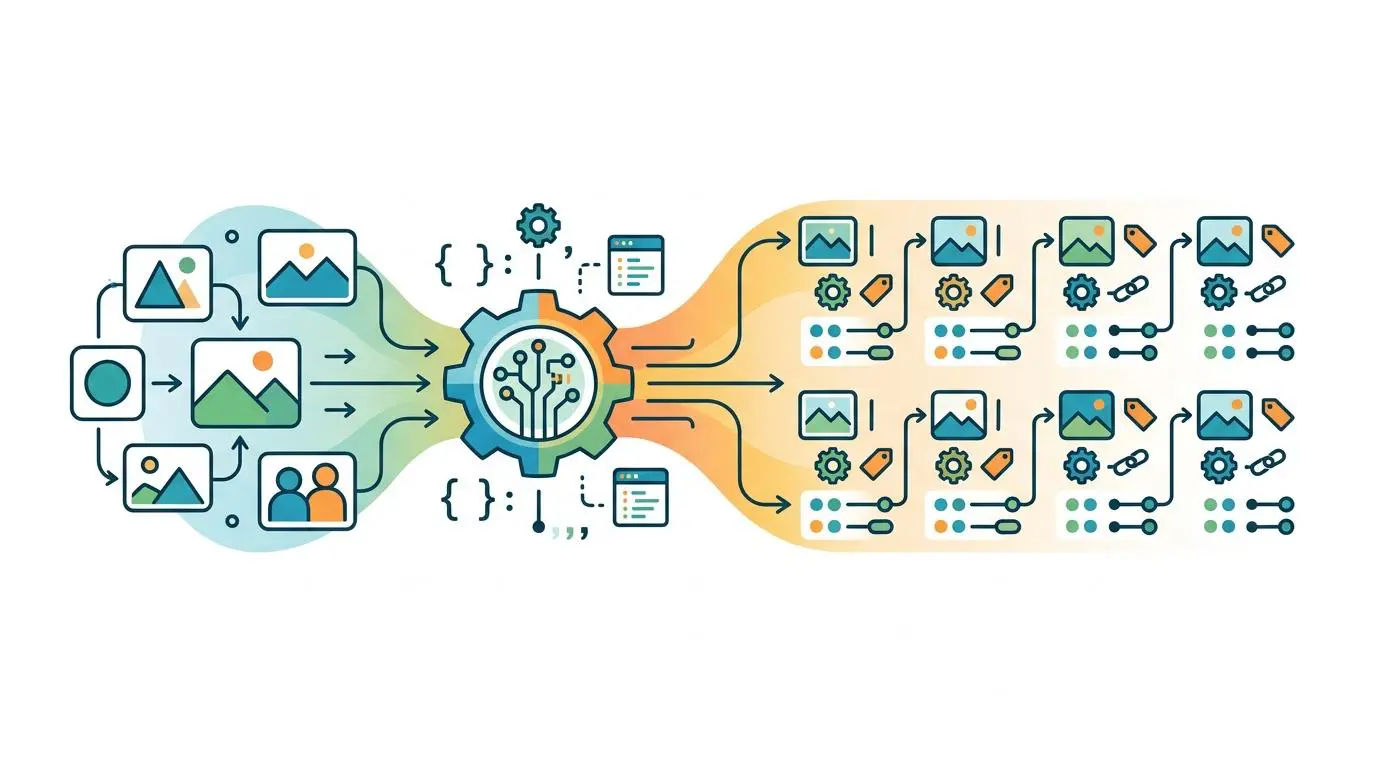
Visual content alone cannot trigger advanced search features without the correct semantic layer. Automated injection of ImageObject and Dataset schema via JSON-LD is now critical. In this architecture, the caption and content URL properties are dynamically pulled directly from the database during the generation phase.
This structured data automation is the key to appearing in multimodal AI Overviews, which heavily prioritize data-dense visuals. When the algorithm parses the exact data points represented in an infographic via the Dataset schema, it is far more likely to feature that image in a zero-click search result.
However, engineers must be cautious of schema bloat. Pages containing multiple generated infographics quickly accumulate excessive JSON-LD scripts. This leads to severe DOM size warnings in Lighthouse, negatively impacting holistic Core Web Vitals scores. Efficient schema consolidation is required to balance semantic depth with rendering performance.
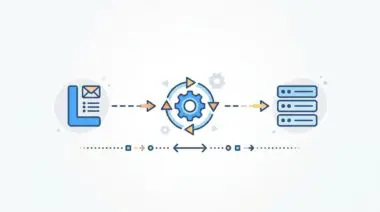
Orchestrating the Indexation Queue
Recent algorithm updates officially prioritize information gain as a top-tier ranking signal. This specifically rewards content that adds unique data visualizations that cannot be found elsewhere on the web. To capitalize on this, the IndexNow API has become a mandatory component of programmatic visual workflows.
Once the database triggers a generation complete status, a webhook immediately pings the IndexNow endpoint. This ensures that newly minted, unique visualizations are crawled and credited for information gain within minutes. Speed to indexation is critical when deploying time-sensitive data visualizations.
The friction here lies in API rate limits. High-volume batch generation easily triggers 429 errors from IndexNow if requests are fired concurrently. Sophisticated asynchronous queuing systems must be implemented to throttle webhook pings, ensuring smooth indexation during major programmatic site updates.
The SVG Micro-App Horizon
The focus of programmatic visual generation is shifting entirely from static images to interactive SVG micro-apps generated on-the-fly at the Edge. These advanced assets allow users to manipulate data directly within the infographic without requiring heavy client-side JavaScript libraries.
This interactivity creates high-intent engagement signals. Evolving search algorithms interpret these interactions as superior user satisfaction metrics compared to passive scrolling on static assets. Preparing your architecture for this shift requires mastering dynamic data pipelines today.
Navigating the intersection of technical SEO, programmatic architecture, and workflow automation requires a sharp strategy. To future-proof your site’s architecture and scale with precision, connect with Andres at Andres SEO Expert.
Frequently Asked Questions
Why is visual uniqueness critical for programmatic SEO in 2026?
Following the June 2026 Google Core Update, search engines now enforce strict visual uniqueness thresholds. Programmatic sites using repetitive stock imagery across thousands of pages are penalized, making dynamic visual generation essential to avoid directory-wide devaluation and maintain organic rankings.
How do data-dense infographics impact visibility in AI Overviews?
Data-rich infographics are a primary driver for appearing in multimodal AI Overviews. Automated visual pipelines that provide structured, data-dense assets satisfy the algorithm’s preference for rich media that answers complex queries at a glance, often leading to significant organic traffic lifts.
What is the role of Google’s Vision API in visual SEO workflows?
Modern workflows use Google’s Vision API for mandatory OCR text extraction as a pre-index check. This ensures that text embedded within a generated infographic is fully machine-readable and semantically aligned with the page content, allowing search engines to accurately index the visual data.
How can engineers optimize crawl budget for high-volume visual assets?
Engineers must implement dynamic WebP or AVIF conversion at the Edge to minimize payload sizes and preserve crawl budget. Coupling this with the IndexNow API ensures that search bots are alerted to new assets instantly and can index them without being slowed down by heavy media files.
Which schema types are required for programmatic visual content?
To trigger placement in multimodal AI Overviews, sites must automate the injection of ImageObject and Dataset schema via JSON-LD. This structured data allows search algorithms to parse the specific data points represented in an infographic, significantly increasing the probability of a zero-click search feature.
How does Bannerbear and Airtable integration help scale SEO?
Integrating Bannerbear V5 with Airtable allows for 1:1 image-to-data mapping where raw data records automatically trigger the creation of unique infographics. This automation guarantees that every programmatic landing page features a statistically unique visual fingerprint, satisfying Google’s mandate for information gain.